

Key Points
- Bitcoin price recovered recently and tested the $6,375 resistance area against the US Dollar.
- There is a significant bearish trend line in place with resistance at $6,400 on the 4-hours chart of the BTC/USD pair (data feed from Kraken).
- The pair must break the $6,365, $6,375 and $6,400 resistance levels to trade higher in the near term.
Bitcoin price is still above the $6,250 support against the US Dollar. However, BTC/USD is facing a crucial resistance near the $6,375-6,400 area.
Bitcoin Price Analysis
This past week, there was a downside extension below the $6,300 support in bitcoin price against the US Dollar. The BTC/USD pair traded close the $6,200 support where buyers emerged. As a result, the price started a decent recovery and moved above the $6,250 and $6,300 resistance levels. The upside move was positive as there was a break above the $6,340 level as well. Besides, the price surpassed the 61.8% Fib retracement level of the recent decline from the $6,429 high to $6,201 low.
However, the upside move stalled near the $6,375 resistance and the 100 simple moving average (4-hours). Moreover, the 76.4% Fib retracement level of the recent decline from the $6,429 high to $6,201 low acted as a resistance. To the topside, there is a significant bearish trend line in place with resistance at $6,400 on the 4-hours chart of the BTC/USD pair. At the outset, there is a contracting triangle forming with resistance near $6,360. Therefore, the price needs to surpass the $6,360, $6,375 and $6,400 resistance levels to trade higher.
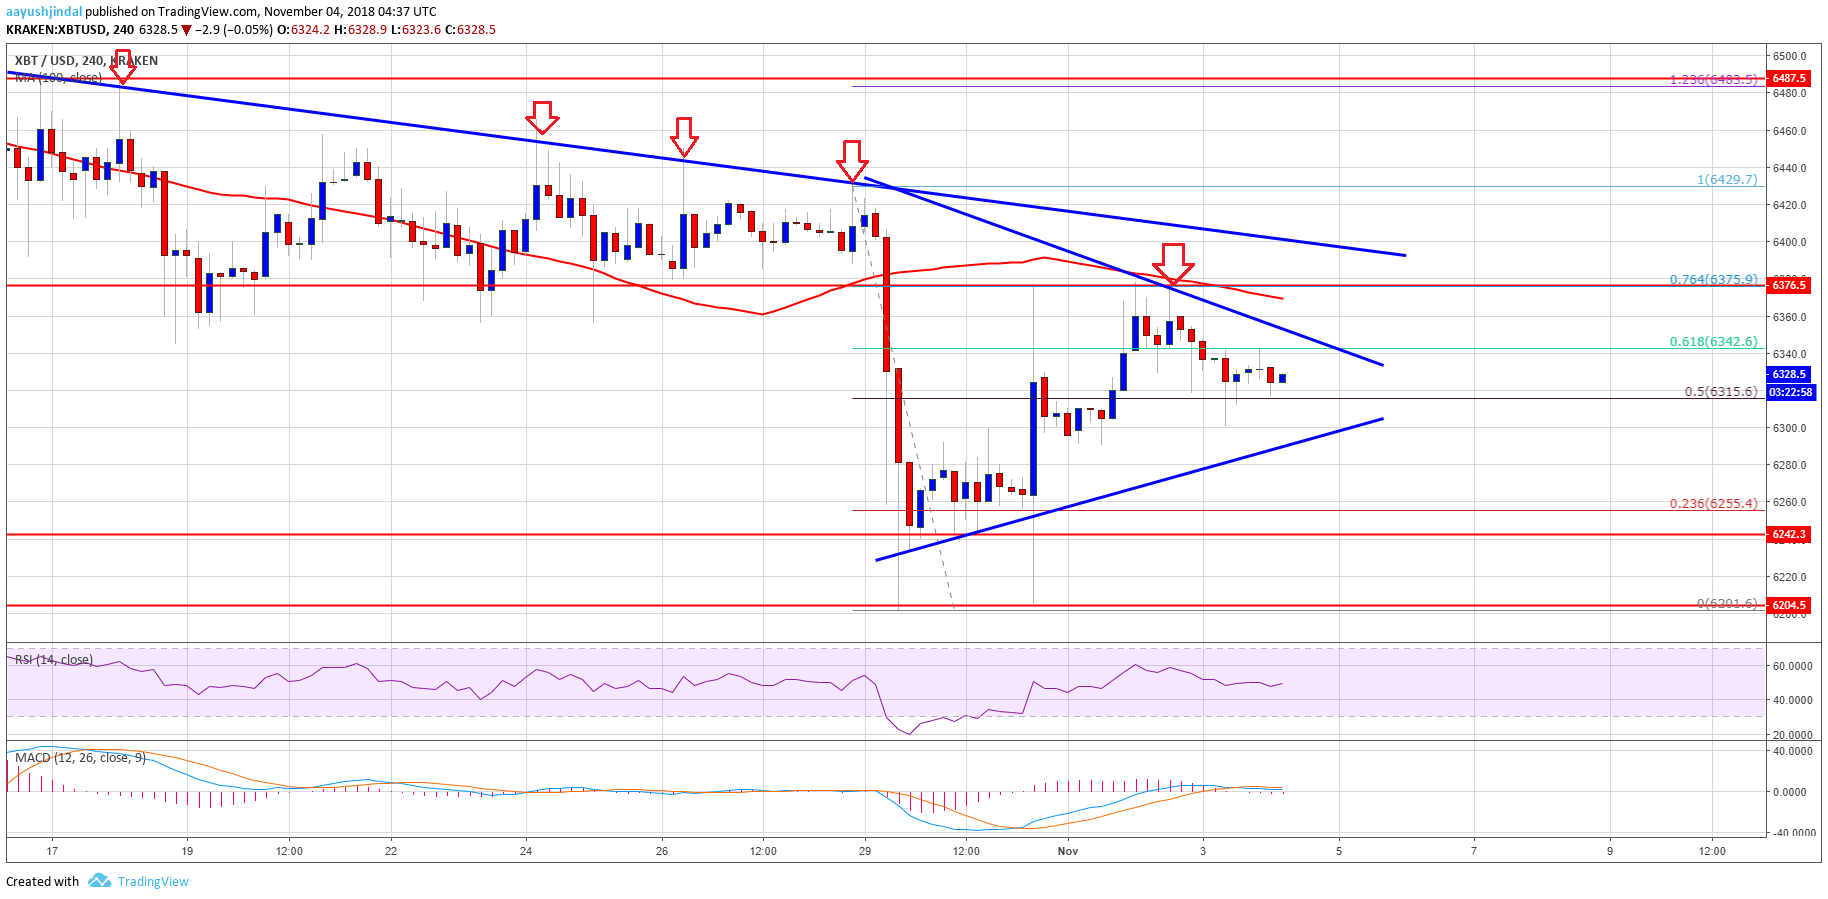

Looking at the chart, BTC price is clearly facing a solid hurdle near the $6,375 and $6,400 levels. If buyers fail to clear these, there could be a bearish reaction back towards the $6,250 or $6,200 support.
Looking at the technical indicators:
4-hours MACD – The MACD for BTC/USD is about to move back in the bearish zone.
4-hours RSI (Relative Strength Index) – The RSI is currently flat near the 50 level.
Major Support Level – $6,250
Major Resistance Level – $6,400