

- Bitcoin price extended gains and broke the $3,950 and $4,000 resistance levels against the US Dollar.
- The price traded to a new 2019 high above $4,100 and it could continue to rise in the near term.
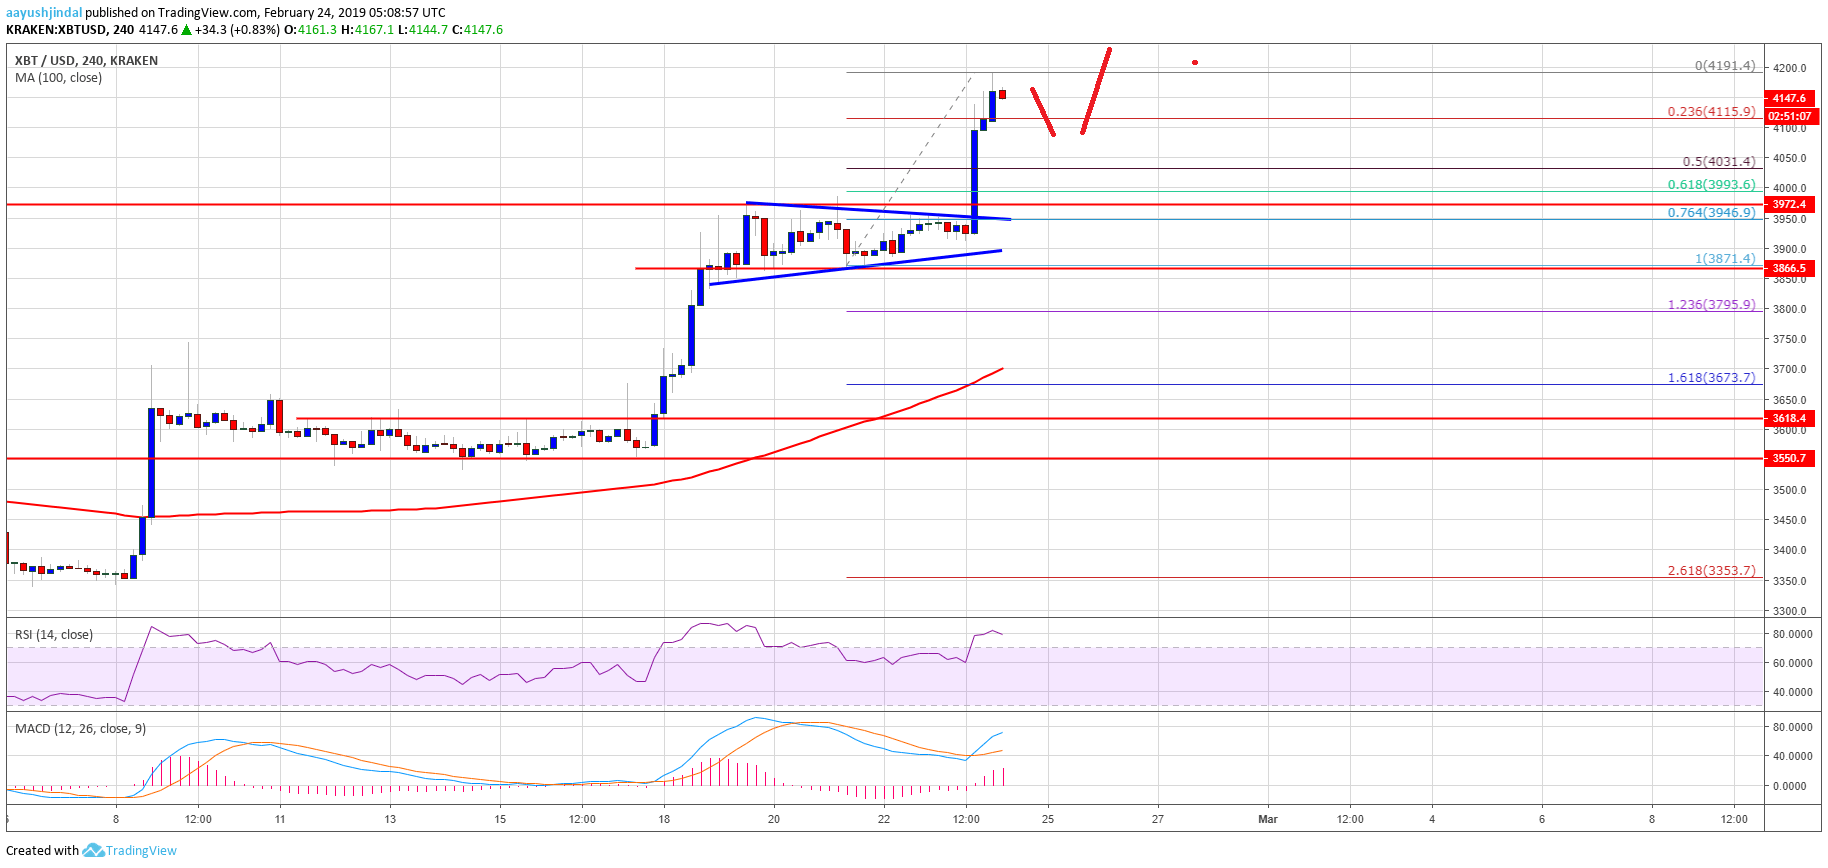
- There was a break above a major triangle pattern with resistance near $3,950 on the 4-hours chart of the BTC/USD pair (data feed from Kraken).
- The pair traded above the $4,150 resistance and it could accelerate towards $4,250 and $4,400.
Bitcoin price climbed higher sharply above the $4,000 barrier against the US Dollar. BTC/USD could correct a few points, but dips remain supported above $4,000 in the short term.
Bitcoin Price Analysis
This past week, we saw a lot of bullish moves above the $3,600 support in bitcoin price against the US Dollar. The BTC/USD pair rallied above the $3,800 and $3,900 resistance levels. However, sellers fought hard near the $3,950 and $4,000 resistance levels. As a result, there were a couple of bearish moves, but the $3,800 support area acted as a solid buy zone. Finally, buyers had the upper hand and pushed the price above the $3,950 and $4,000 resistance levels.
More importantly, there was a break above a major triangle pattern with resistance near $3,950 on the 4-hours chart of the BTC/USD pair. The pair settled above the $4,000 level and the 100 simple moving average (4-hours). The upward move was such that the price traded to a new 2019 high above $4,100. It traded towards the $4,200 level and a high was formed at $4,191. The price is currently correcting lower, but it remains well supported above $4,100 and $4,050. An initial support is the 23.6% Fib retracement level of the last wave from the $3,871 low to $4,191 high.
On the downside, there are many supports near the $4,050 level. Below $4,050, the next support is near the $4,030 level. It represents the 50% Fib retracement level of the last wave from the $3,871 low to $4,191 high. The main support is near the $4,000 level (the previous resistance). Therefore, if there is a downside correction, the price may perhaps find buyers near $4,050 and $4,000.

Looking at the chart, BTC price is placed nicely in a strong uptrend above the $4,000 resistance area. In the short term, there could be a pullback, but buyers are likely to protect $4,000. On the upside, a break above the $4,200 level could open the doors for $4,250 and $4,400.
Technical indicators
4 hours MACD – The MACD for BTC/USD is gaining pace in the bullish zone.
4 hours RSI (Relative Strength Index) – The RSI for BTC/USD is currently well above the 70 level.
Major Support Level – $4,000
Major Resistance Level – $4,200