

Key Points
- Bitcoin price declined sharply this past week, as it traded lower not only against the USD but also vs the ETH.
- There was a downside move towards the $435 support level, which prevented further losses.
- There is likely a double bottom pattern formed on the hourly chart (data feed from Bitstamp) of BTC/USD, which may push the price higher.
Bitcoin price traded down this past week vs the US dollar, but is looks like BTC/USD is now forming a bullish pattern, which may push it higher.
Bitcoin Price – Recovery Likely?
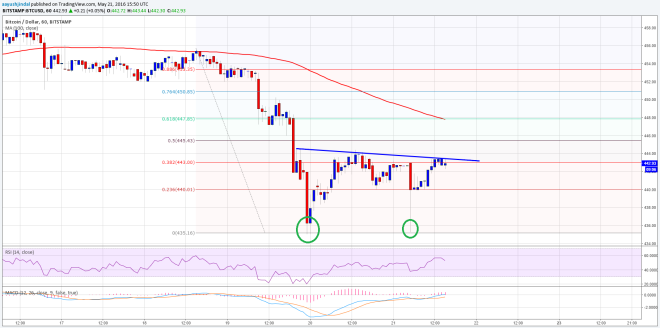
Bitcoin price managed to recover after trading as low as $435 vs the US dollar. The price is currently trading near a bearish trend line formed on the hourly chart (data feed from Bitstamp) of BTC/USD, which is acting as a resistance area. However, the most important point for the BTC/USD buyers is the fact that there is a bullish pattern creating in the form of a double bottom pattern on the hourly chart.
If the highlighted double bottom pattern on the hourly chart is true, then there is a chance of BTC moving higher in the near term. The price is currently trading near the 38.2% Fib retracement level of the last drop from the $456 high to $435 low. So, if the BTC bulls manage to break the trend line and the 38.2% Fib level, then there is a possibility of a move towards the 61.8% Fib retracement level of the last drop from the $456 high to $435 low.

If you are looking to buy BTC/USD, then you can consider buying in the short term with a target of 100 hourly simple moving average and a stop of not more than a point.
Looking at the technical indicators:
Hourly MACD – The MACD is in the bullish slope, which is a positive sign.
Hourly RSI (Relative Strength Index) – The RSI is above the 50 level, calling for more gains in the near term.
Major Support Level – $440
Major Resistance Level – $445
Charts from Bitstamp; hosted by Trading View
Header Image: NewsBTC