

Key Highlights
- Bitcoin price failed to trade above the $500 level, and there was no daily close above the stated level this past week.
- The price traded lower after the failure to break the stated resistance area, and moved below the $400 level.
- In the last weekly analysis, I highlighted a triangle pattern on the daily chart with the data feed from HitBTC, which was cleared to ignite a downside move.
Bitcoin price may have created a short-term top around the $500 level, and it looks like the price may struggle to hold more losses moving ahead.
Price at Critical Area?
Bitcoin price found it hard this past week to trade higher, especially above the $500 mark. There were sellers around the stated level aligned from a long time defending the upside move. Finally, they managed to push the price down. There was a contracting triangle pattern formed on the daily chart via the data feed from HitBTC, as highlighted in the past weekly analysis.
The highlighted triangle pattern was acting as a support area for the price, but once sellers managed to break it, the downside move was sharp.
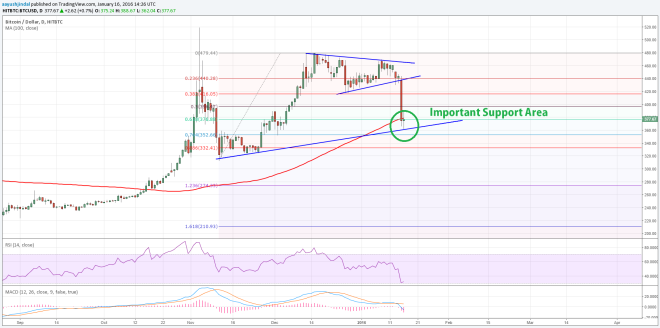

The price cracked the 23.6% Fib retracement level of the last wave from the $313 low to $479 high. Once there was a break, then there was no stopping sellers. They took the price closer to the 100-day simple moving average (data feed from HitBTC).
This is not all, as the 61.8% Fib retracement level of the last wave from the $313 low to $479 high was also cleared. Currently, the price is trading near a critical support area. There is a support trend line formed on the daily chart, which is acting as a hurdle for sellers.
The best part is that the 100-day simple moving average along with the 76.4% Fib retracement level of the last wave from the $313 low to $479 high is positioned around the highlighted trend line and support area. So, as long as the price is above it, there is a chance of a minor recovery in the short term. The downside slide is more evident if we look at the hourly chart via the data feed from Bitstamp.
There was a sharp decline of more than $50 from the high to low. There are now a couple of important bearish trend lines formed on the hourly chart, which are acting as a resistance area for a recovery in Bitcoin price.
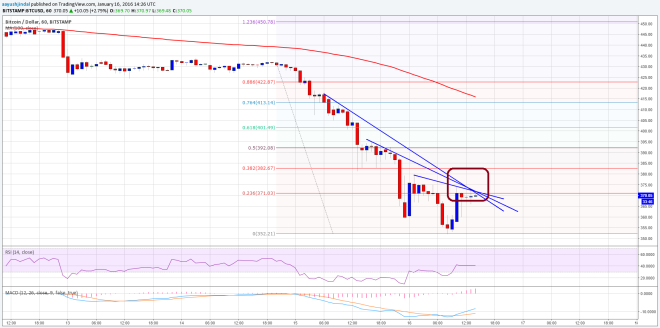
There is a major confluence resistance area formed near the trend lines, as the 23.6% Fib retracement level of the last wave from the $432 high to $352 low. If buyers manage to break the highlighted trend line and confluence area, then a move towards the 50% Fib retracement level of the last wave from the $432 high to $352 low is also possible in the short term.
Looking at the indicators:
Daily MACD – The daily MACD is in the bearish zone, suggesting that sellers are here to stay.
RSI (Relative Strength Index) – The daily RSI is around the oversold area, presenting a chance of a correction.
Intraday Support Level – $350
Intraday Resistance Level – $380
Charts from HitBTC and Bitstamp; hosted by Trading View