

Key Highlights
- The Bitcoin price recently corrected higher after declining close to the ¥1800 level.
- It looks like the price has completed the correction phase and may start trading lower once again.
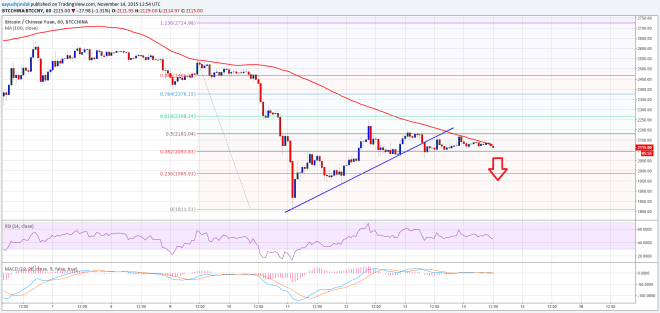
- There was a major support trend line formed on the hourly chart (price feed from BTCChina), which was broken to ignite a downside move.
Bitcoin price rebound from the ¥1811 low is likely completed and it may start to move lower if sellers gain momentum.

Retest of ¥2000 Likely?
The Bitcoin price managed to gain bids near the ¥1800 support area and managed to recover some ground. However, it looks like the recovery is now over and the price may start to move lower once again. The price recently tested a monster confluence resistance area of ¥2200 where the 100 hourly simple moving average (MA) along with the 50% Fib retracement level of the last drop from the ¥2550 high to ¥1811 low prevented the upside. There was a bullish trend line formed on the hourly chart, which was breached recently to encourage sellers to take the price lower.
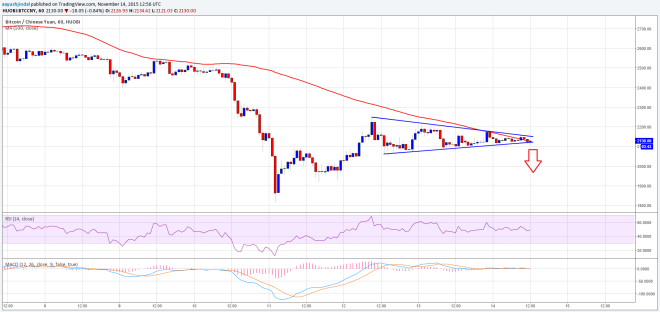
There is contracting triangle pattern forming as well (price feed from Huobi), which might act as a catalyst for the next move. If sellers gain control and manage to take the price below the triangle, then a downside move towards ¥2000 is possible.

Looking at the indicators:
MACD – The hourly MACD is mostly flat is it looks like setting up for the next move that may be a bear leg.
RSI (Relative Strength Index) – The hourly RSI below the 50 level, which is a sign that buyers are losing grip.
On the upside a break and close above the 100 MA is needed if the price has to trade higher.
Intraday Support Level – ¥2000
Intraday Resistance Level – ¥2200
Overall, a break and close below the highlighted triangle may be a signal for a sell in the short term.
Charts from BTCChina and Huobi; hosted by Trading View