

Binance coin price is up over 50% and it is outperforming bitcoin against the USDT. BNB rallied above USD 100 and USD 125, and it is likely to continue higher.
- Binance coin price is gaining bullish momentum above the $120 level against the USDT.
- The price is up over 50% and it traded to a new all-time high near $126.
- There was a break above an ascending channel with resistance near $120 on the 4-hours chart of the BNB/USDT pair (data source from Binance).
- There are chances of more upsides above the $130 and $140 levels in the near term.
Binance Coin Price Is Gaining Momentum
In the past few days, bitcoin, Ethereum, ripple, and binance coin remained in a strong uptrend. BNB price broke many hurdles near the $80 and $100 levels.
The price even settled above the $100 level and the 100 simple moving average (4-hours). The recent increase gained pace after there was a break above a declining channel with resistance near $70 on the 4-hours chart of the BNB/USDT pair.
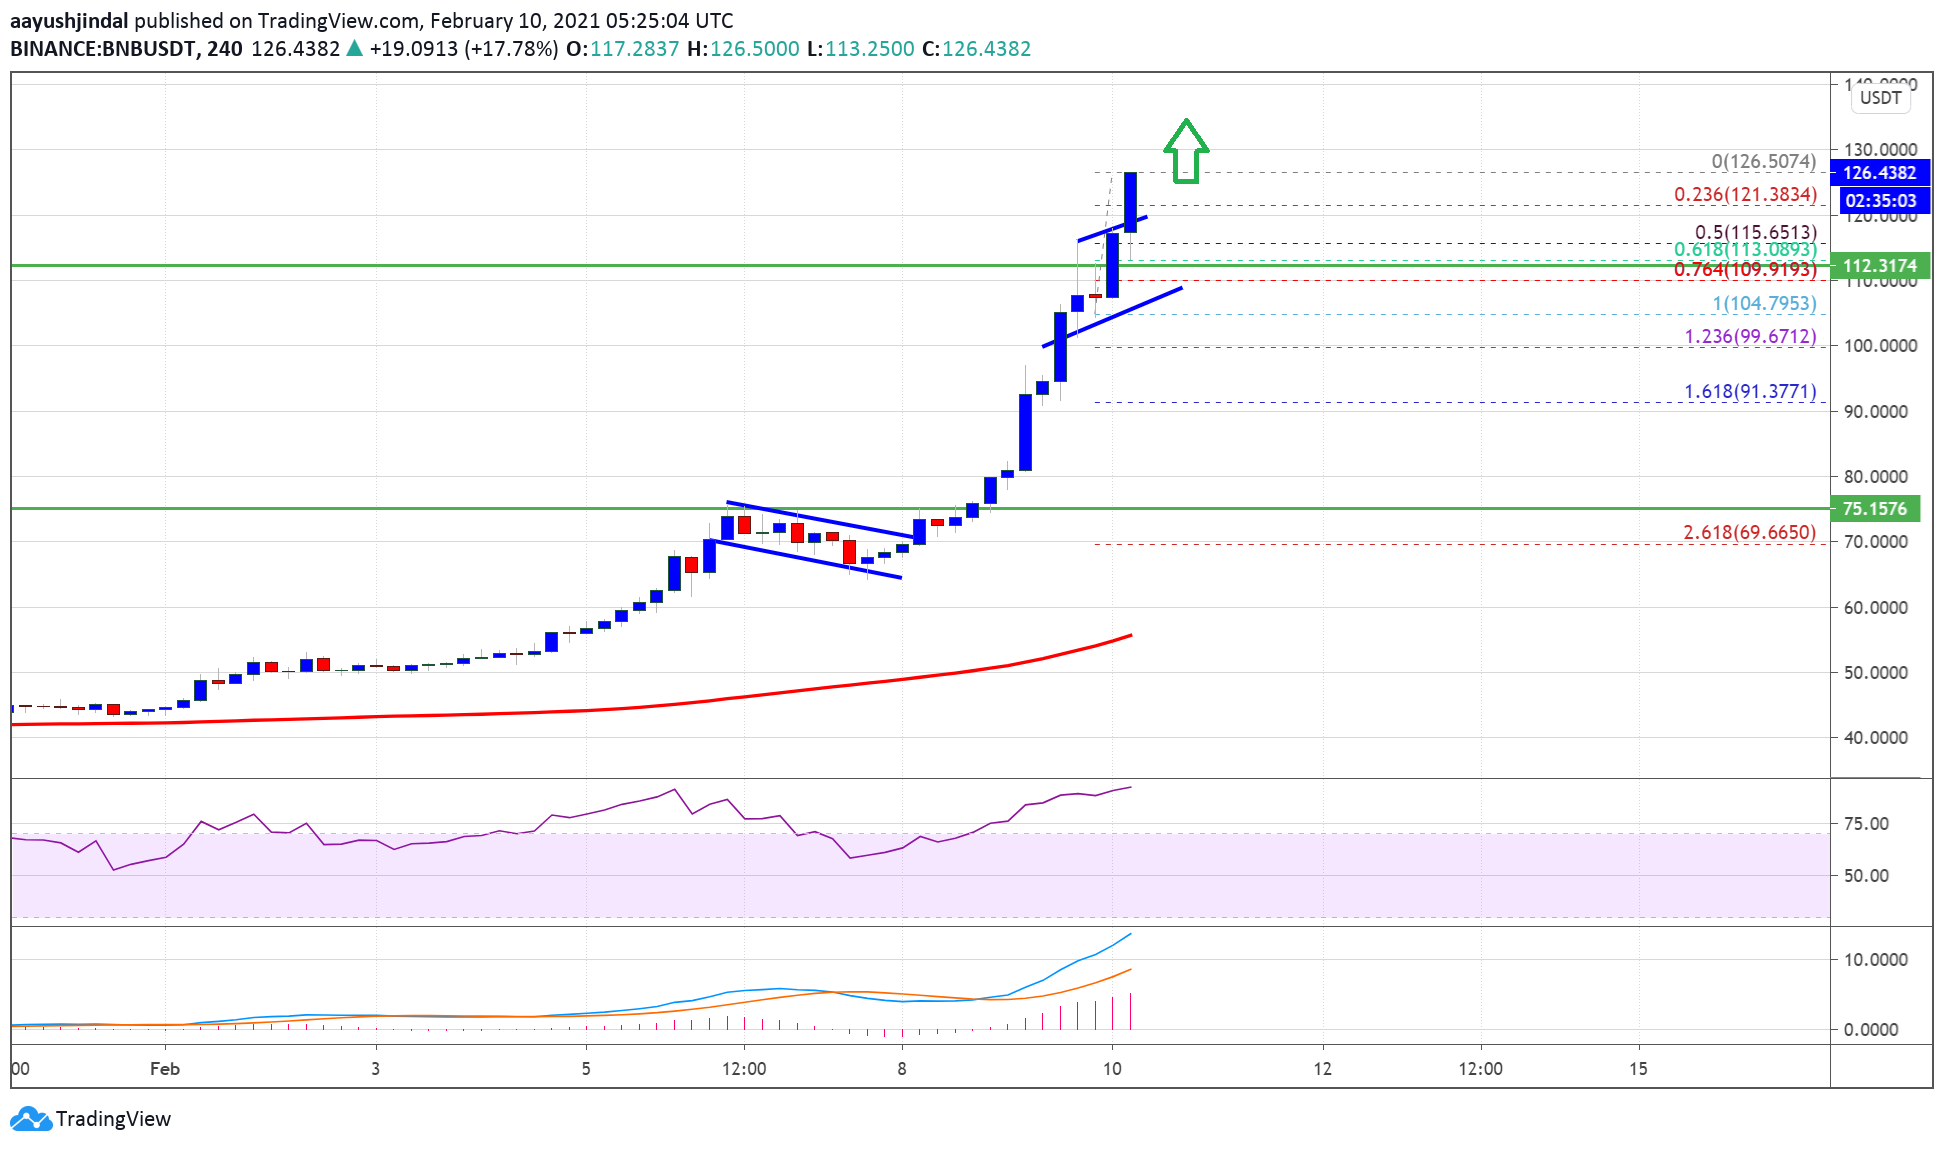
The pair even broke the $120 level and traded to a new all-time high above $125. Recently, there was a break above an ascending channel with resistance near $120 on the same chart. The price is showing a lot of positive signs and it is likely to continue high above USD 130.
Any more gains could open the doors for a steady rise towards the $148 and $150 resistance levels in the near term.
Dips Supported in BNB
If BNB fails to clear the $130 and $132 levels, it could start a downside correction. An initial support is near the $120 level. It is close to the 23.6% Fib retracement level of the upward move from the $104 swing low to $126 high.
The first major support is near the $115 level. It is close to the 50% Fib retracement level of the upward move from the $104 swing low to $126 high. Any more losses may perhaps lead the price towards the $100 support level in the coming days.
Technical Indicators
4-Hours MACD – The MACD for BNB/USDT is gaining momentum in the bullish zone.
4-Hours RSI (Relative Strength Index) – The RSI for BNB/USDT is currently well in the overbought zone.
Major Support Levels – $120, $115 and $100.
Major Resistance Levels – $130, $135 and $150.