

BNB is showing signs of a sustained bullish breakout after retesting and holding a former resistance zone as new support, signaling strong technical resilience and growing confidence. With upward momentum building and buyers defending key levels, the price action suggests a potential continuation toward higher resistance zones, hinting at the start of a broader rally.
BNB Eye A Push Toward $794 ATH
According to crypto analyst UniChartz, BNB is exhibiting strong bullish momentum after staging an impressive rebound from a key support zone. Once a formidable resistance barrier, this level has now flipped into solid support, reinforcing the strength of the breakout that preceded it. Its ability to hold above this former ceiling signals a potential shift in market dynamics, where bulls appear to be regaining control.
UniChartz emphasized that such a price action structure often marks the beginning of a new upward phase, especially when the support zone is tested shortly after a breakout. This validation boosts trader confidence and lays the groundwork for a continued upside trend. With momentum indicators also turning favorable, the stage could be set for BNB to reach higher targets in the sessions ahead.

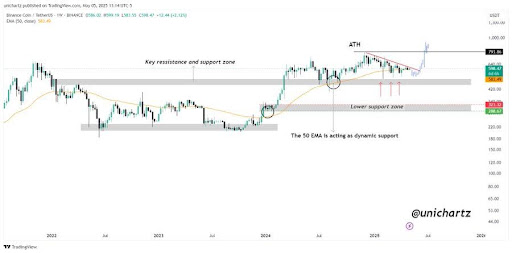
He further noted that as long as BNB stays above the support zone, its bullish structure remains intact. This level now acts as a firm foundation, keeping the momentum tilted in favor of the bulls. With this strong base, the path toward a new All-Time High (ATH) near $794 appears open.
He also pointed out that the 50-day Exponential Moving Average (EMA) is serving as dynamic support, which has consistently cushioned price dips and helped guide the uptrend. As long as BNB holds above the 50 EMA and maintains higher lows and volume increases, it could further reinforce the potential for a sustained rally.
What Momentum Indicators Are Saying
Key indicators are beginning to align with the bullish narrative surrounding BNB’s rebound. The Relative Strength Index (RSI) has bounced from near-neutral territory and is now edging higher, signaling increased buying pressure outside overbought conditions. This rising RSI is a classic confirmation that the recent bounce may be more than just a temporary reaction, leaving room for further upside.
Meanwhile, the Moving Average Convergence Divergence (MACD) is showing signs of a potential bullish crossover. The histogram bars are shrinking toward the zero line, and the MACD line is attempting to break above the signal line, often seen as a momentum shift in favor of the bulls.

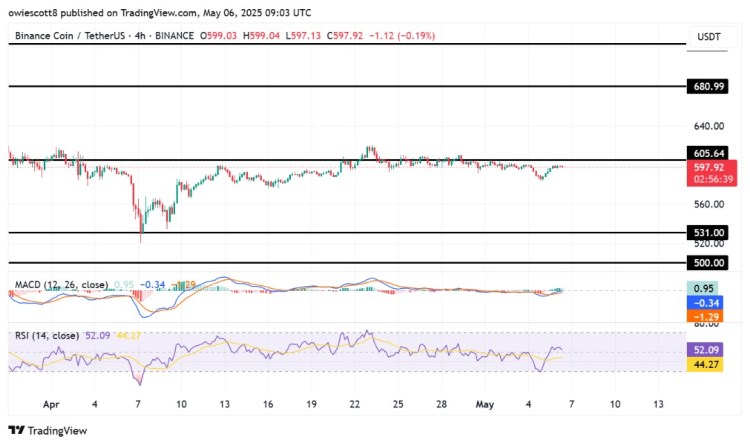
If confirmed, this crossover could push BNB to higher resistance levels, particularly with price action holding firm above the 50 EMA. Together, these indicators reinforce the idea that momentum is building following the recent bounce, and BNB could be preparing for a sustained upward leg.
