
Reason to trust
How Our News is Made
Strict editorial policy that focuses on accuracy, relevance, and impartiality
Ad discliamer
Morbi pretium leo et nisl aliquam mollis. Quisque arcu lorem, ultricies quis pellentesque nec, ullamcorper eu odio.
Bitcoin price extended its rise above the $11,500 resistance against the US Dollar. BTC is correcting lower from $11,700, but it is likely to find support near the 100 hourly SMA.
- Bitcoin broke the key $11,500 resistance level and traded to a new weekly high at $11,724.
- The price is currently correcting lower below $11,500, but it is above the 100 hourly simple moving average.
- There is a connecting bullish trend line forming with support near $11,320 on the hourly chart of the BTC/USD pair (data feed from Kraken).
- The pair could start a fresh increase as long as it is above the $11,200 support and the 100 hourly SMA.
Bitcoin Price Remains Strong
After a couple of failed attempts, bitcoin price finally broke the $11,500 resistance against the US Dollar (as discussed yesterday). BTC even surpassed the $11,650 level and settled well above the 100 hourly simple moving average.
It traded to a new monthly high near $11,724 before starting a short-term downside correction. There was a break below the $11,600 and $11,500 levels. It is currently testing the 50% Fib retracement level of the recent increase from the $11,199 low to $11,724 high.
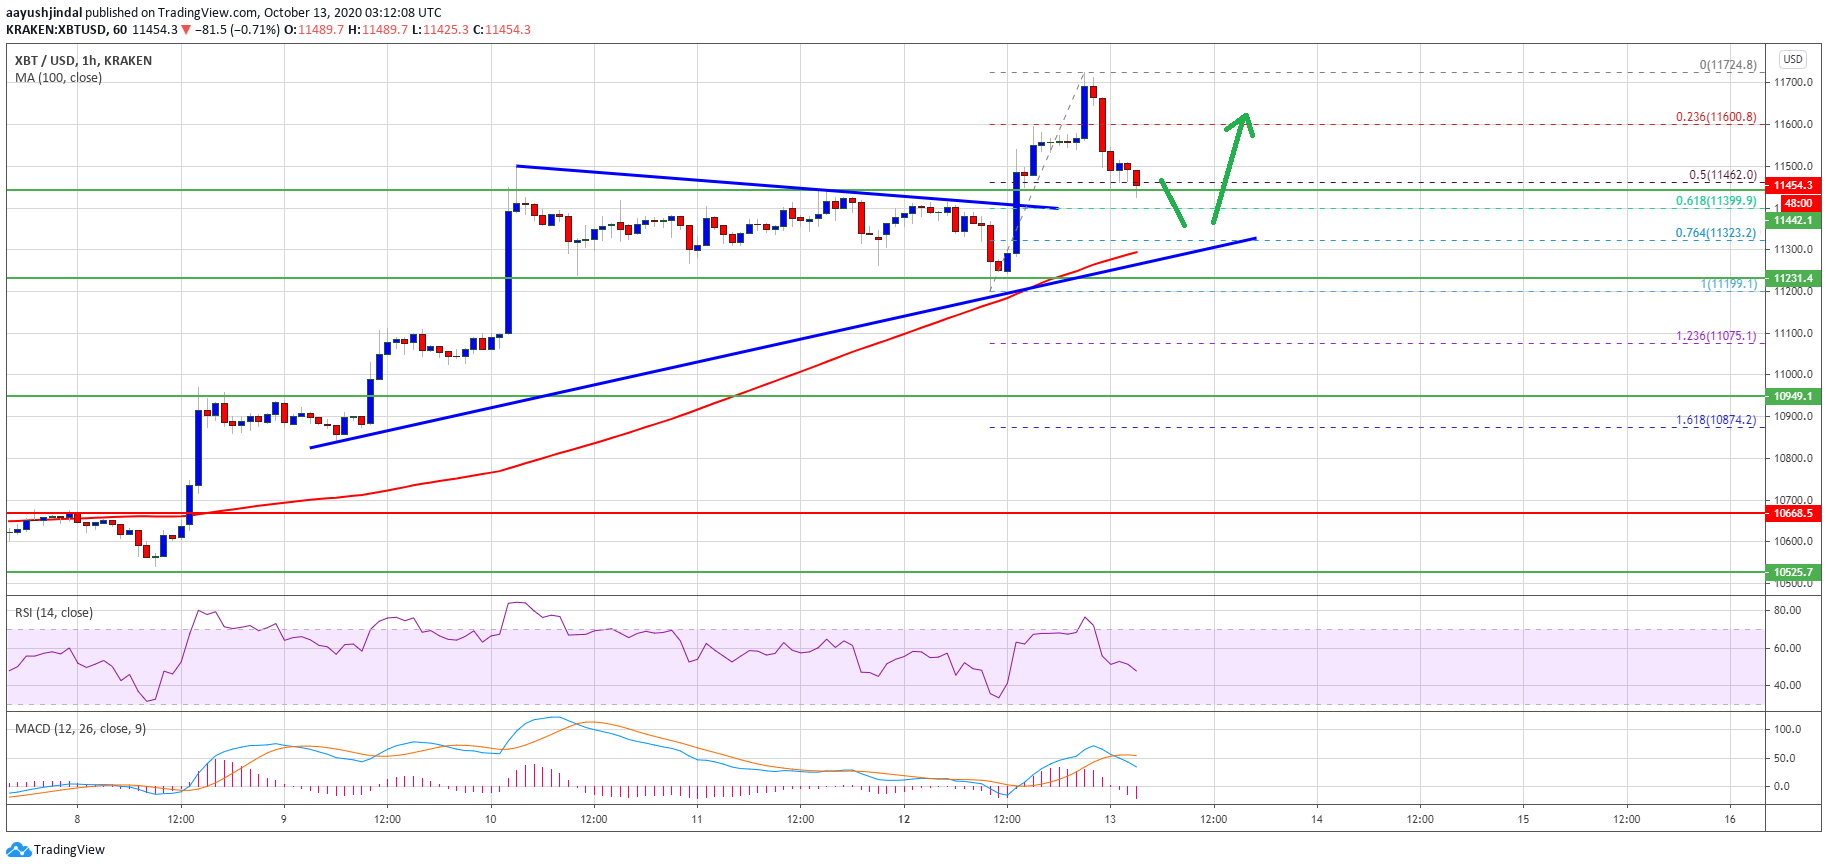
Bitcoin price trades below $11,500. Source: TradingView.com
The first major support is near the $11,400 level. It is close to the 61.8% Fib retracement level of the recent increase from the $11,199 low to $11,724 high. There is also a connecting bullish trend line forming with support near $11,320 on the hourly chart of the BTC/USD pair.
On the upside, the price is facing a short-term resistance at $11,500. The next key resistance is near the $11,700 level, but the main hurdle for the bulls is near $11,800. A break above $11,800 might increase the chances of more upsides above $12,000.
Dips Supported in BTC?
Bitcoin is likely to find support near the $11,400 level or the bullish trend line. The 100 hourly simple moving average is also near the $11,300 level.
The main support is likely forming near $11,200 (this week’s base), below which the bears are likely to gain strength. The next key support below $11,200 is near the $11,000 level.
Technical indicators:
Hourly MACD – The MACD is currently losing momentum in the bullish zone.
Hourly RSI (Relative Strength Index) – The RSI for BTC/USD is currently declining and it is close to the 50 level.
Major Support Levels – $11,400, followed by $11,300.
Major Resistance Levels – $11,500, $11,700 and $11,800.


