
Reason to trust
How Our News is Made
Strict editorial policy that focuses on accuracy, relevance, and impartiality
Ad discliamer
Morbi pretium leo et nisl aliquam mollis. Quisque arcu lorem, ultricies quis pellentesque nec, ullamcorper eu odio.
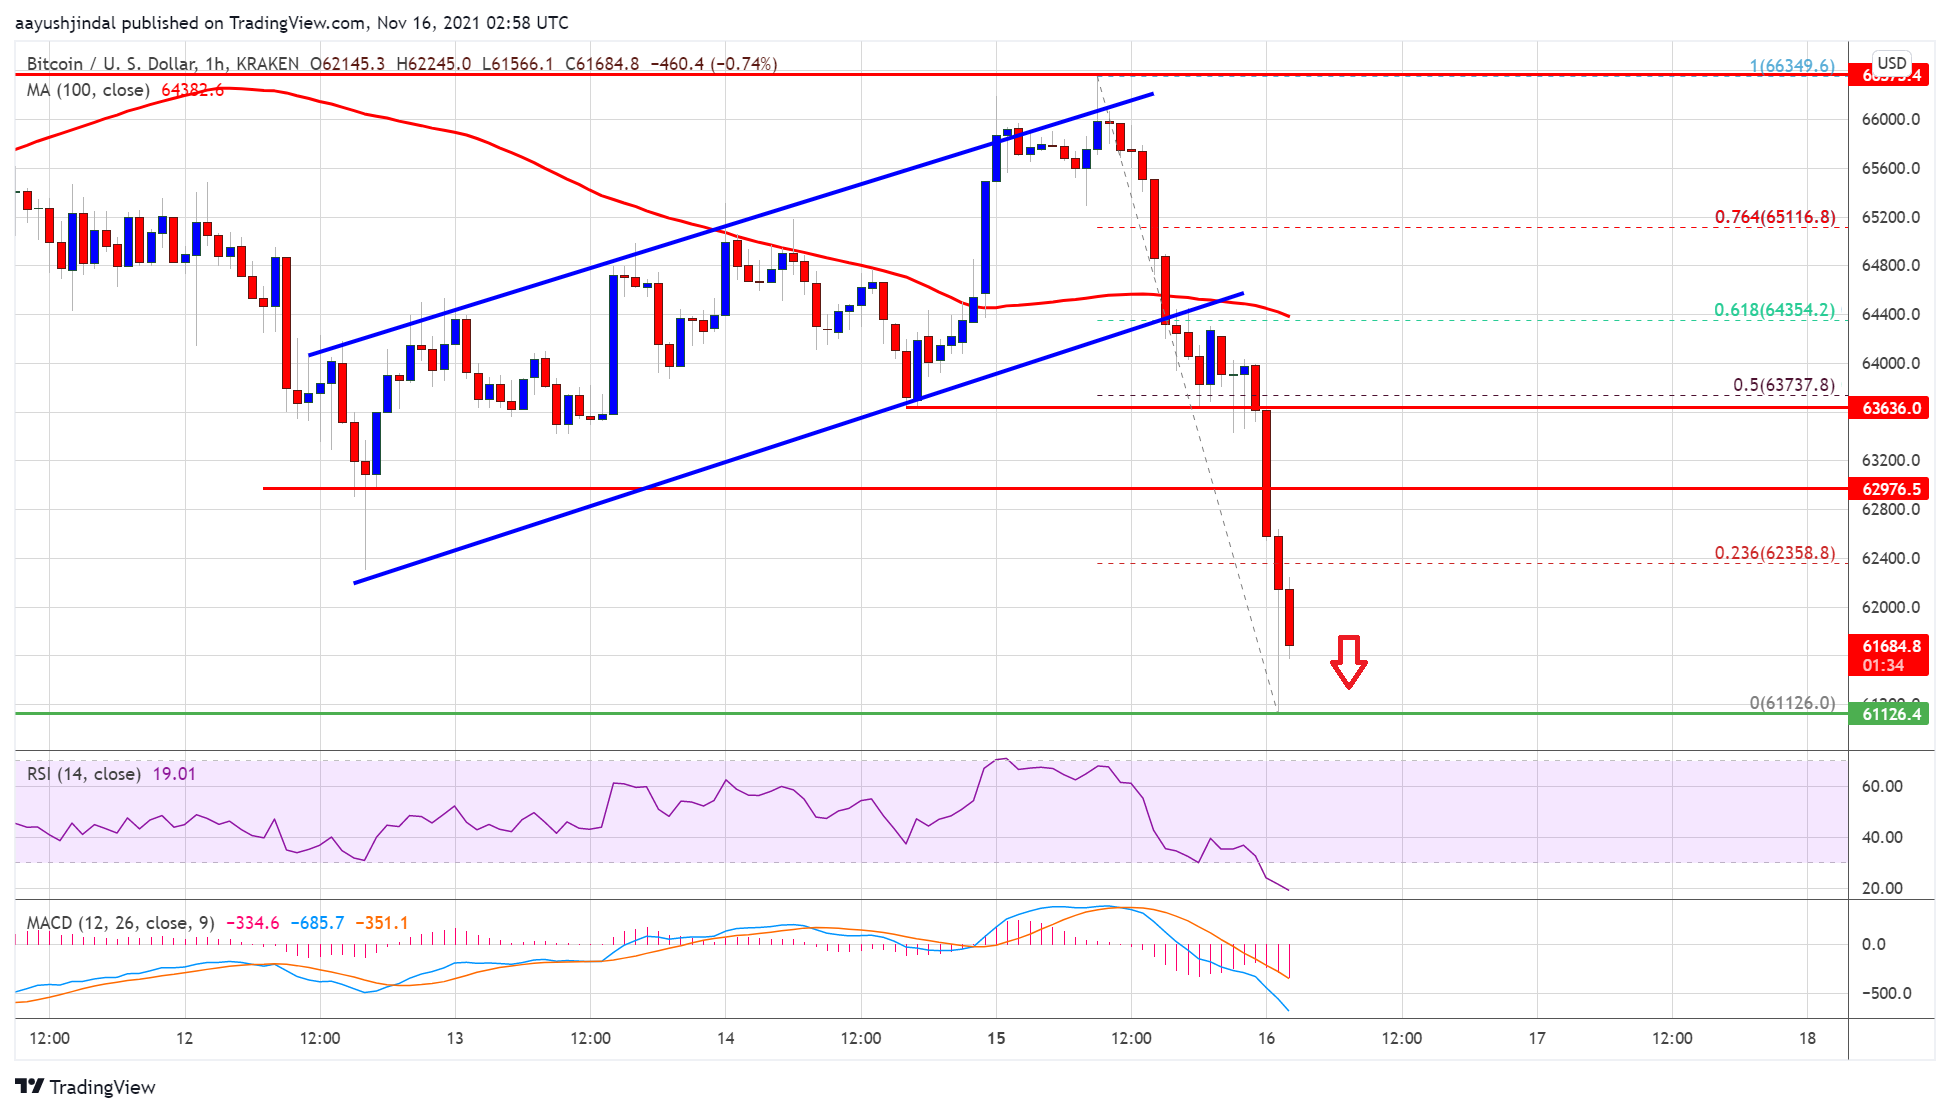
Bitcoin price failed to settle above $65,000 against the US Dollar. BTC started a fresh decline, and it might extend losses below the $60,000 support.
- Bitcoin started a fresh decline from the $66,400 resistance zone.
- The price is now trading well below $65,000 and the 100 hourly simple moving average.
- There was a break below a major rising channel with support near $64,400 on the hourly chart of the BTC/USD pair (data feed from Kraken).
- The pair could extend losses below the $61,200 and $60,500 support levels in the near term.
Bitcoin Price Starts Fresh Decline
Bitcoin price failed to gain strength above the $66,000 resistance zone. BTC topped near $66,400 and started a fresh decline. There was a major decline below the $65,000 support level and the 100 hourly simple moving average.
The price even traded below the $63,500 and $63,000 support levels. Besides, there was a break below a major rising channel with support near $64,400 on the hourly chart of the BTC/USD pair. The bears gained momentum for a move below the $62,000 support zone.
A low is formed near $61,126 and the price is now consolidating losses. On the upside, an immediate resistance is near the $62,000 level. The first major resistance is near the $62,400 level. It is close to the 23.6% Fib retracement level of the recent decline from the $66,349 swing high to $61,126 low.
A clear break above $62,400 resistance may possibly call open the doors for a steady recovery. The next major resistance sits near the $63,000 level. The main breakout resistance is now forming near the $63,750 level.
Source: BTCUSD on TradingView.com
The 50% Fib retracement level of the recent decline from the $66,349 swing high to $61,126 low is also near the $63,750 level to act as a key hurdle.
More Losses in BTC?
If bitcoin fails to recover above the $63,000 resistance zone, it could extend decline. An immediate support on the downside is near the $61,200 level.
The first major support is now forming near the $61,000 level. The next major support is near the $60,000 level, below which the bulls could struggle to keep the price in the green zone in the short-term.
Technical indicators:
Hourly MACD – The MACD is now gaining pace in the bearish zone.
Hourly RSI (Relative Strength Index) – The RSI for BTC/USD is now in the oversold zone.
Major Support Levels – $61,200, followed by $60,000.
Major Resistance Levels – $62,400, $63,000 and $63,750.


