Reason to trust
How Our News is Made
Strict editorial policy that focuses on accuracy, relevance, and impartiality
Ad discliamer
Morbi pretium leo et nisl aliquam mollis. Quisque arcu lorem, ultricies quis pellentesque nec, ullamcorper eu odio.
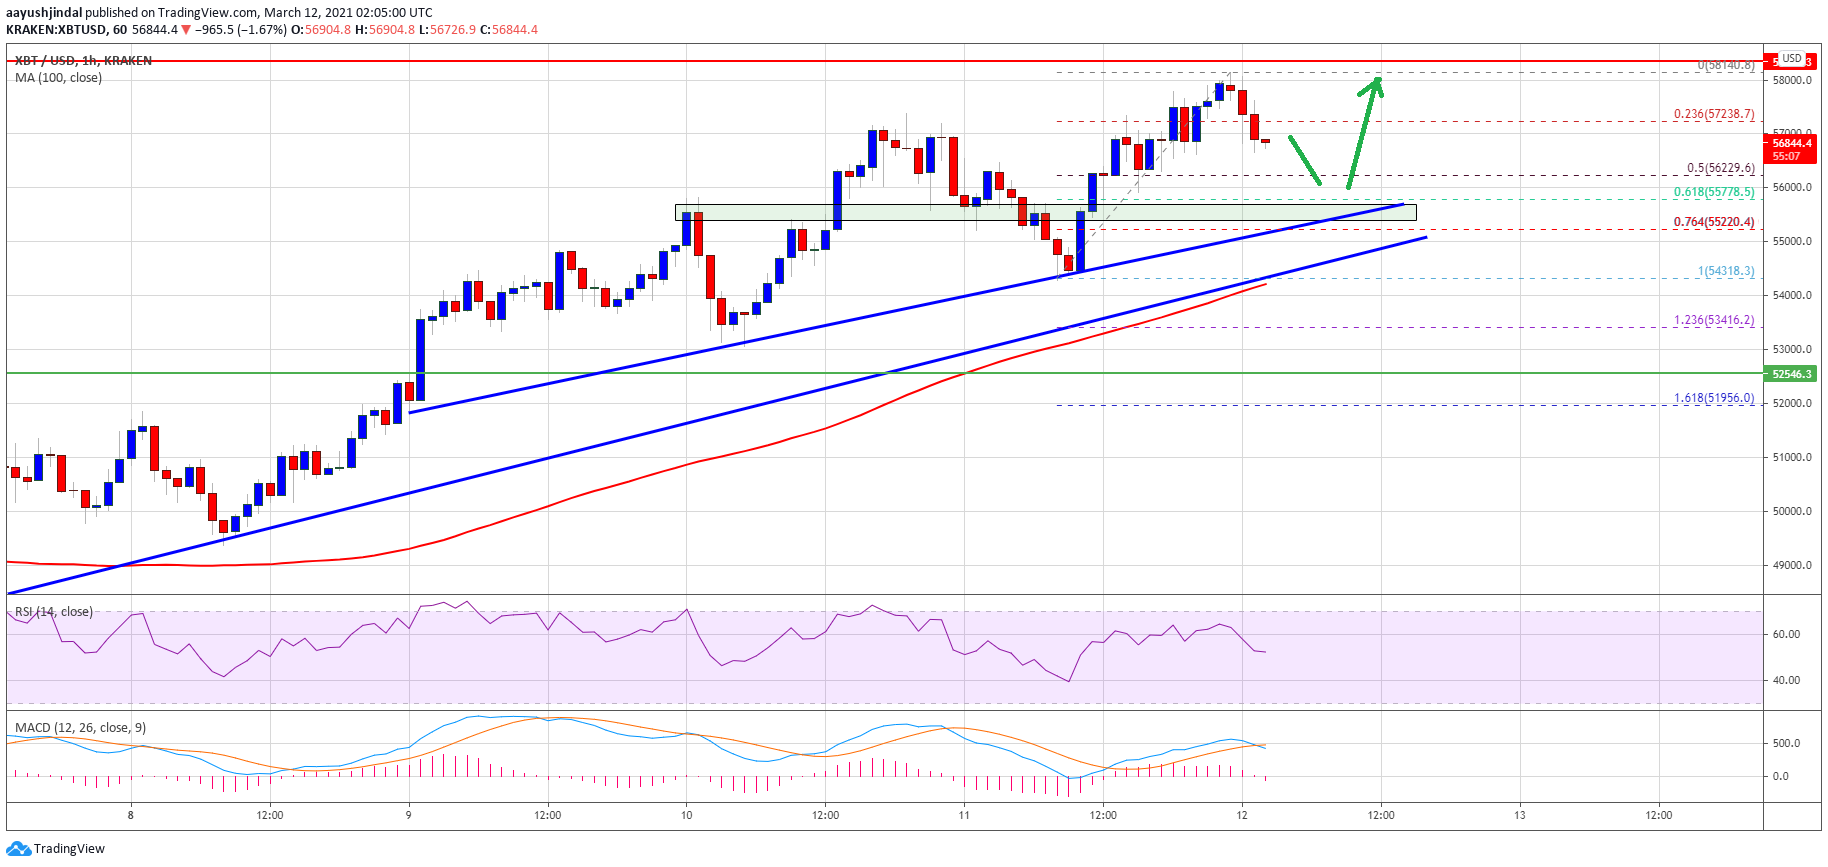
Bitcoin price extended its rise and it even tested the $58,000 resistance against the US Dollar. BTC is showing positive signs and it is likely to accelerate higher above $60,000.
- Bitcoin remains in a bullish zone and it even climbed above the $58,000 resistance.
- The price is now trading well above $56,000 and the 100 hourly simple moving average.
- There are two bullish trend lines forming with support near $55,650 and $55,000 on the hourly chart of the BTC/USD pair (data feed from Kraken).
- The pair could correct lower, but the bulls are likely to remain active above $55,000.
Bitcoin Price is Gaining Momentum
After a close above the $55,000 resistance, bitcoin extended its rise above $56,000. BTC settled nicely above the $55,000 level and the 100 hourly simple moving average.
It opened the doors for a push above the $57,000 and $57,500 resistance levels. The price even spiked above the $58,000 resistance and traded to a new monthly high at $58,140. It is now correcting lower and trading below the $58,000 level.
There was a break below the 23.6% Fib retracement level of the recent increase from the $54,318 swing low to $58,140 high. On the downside, there are two bullish trend lines forming with support near $55,650 and $55,000 on the hourly chart of the BTC/USD pair.
Source: BTCUSD on TradingView.com
On the upside, the price is likely to face sellers near the $58,000 zone. A clear close above the $58,000 resistance will most likely start a strong increase. The next target for the bulls could be $60,000 in the near term. Any more gains could lead the price towards the $62,000 level.
Dips Supported in BTC?
If bitcoin fails to clear the $58,000 resistance, it could correct lower. The first key support is near the $56,200 level. It is close to the 50% Fib retracement level of the recent increase from the $54,318 swing low to $58,140 high.
The main support is near the trend line and $55,500. Any more losses might call for a test of the $55,000 support level. If the bulls fail to defend the $55,000 support zone, the price is likely to dive towards the $52,000 support in the coming sessions.
Technical indicators:
Hourly MACD – The MACD is slowly losing momentum in the bullish zone.
Hourly RSI (Relative Strength Index) – The RSI for BTC/USD is declining towards the 50 level.
Major Support Levels – $55,650, followed by $55,000.
Major Resistance Levels – $58,000, $58,500 and $60,000.