
Reason to trust
How Our News is Made
Strict editorial policy that focuses on accuracy, relevance, and impartiality
Ad discliamer
Morbi pretium leo et nisl aliquam mollis. Quisque arcu lorem, ultricies quis pellentesque nec, ullamcorper eu odio.
Bitcoin price extended its rise above the $58,000 resistance against the US Dollar. BTC is now correcting gains, with but it is likely to remain well bid near $56,750 and $56,500.
- Bitcoin gained pace above the $57,500 and $58,000 resistance levels before correcting lower.
- The price is now well above the $55,000 support and the 100 hourly simple moving average.
- There is a key bullish flag pattern forming with resistance near $57,700 on the hourly chart of the BTC/USD pair (data feed from Kraken).
- The pair is likely to find a strong buying interest near the $56,500 support zone in the near term.
Bitcoin Price Eyes More Upsides
After surpassing the $57,000 resistance, bitcoin extended its rise. BTC broke the $58,000 resistance level and settled nicely above the 100 hourly simple moving average.
It even surged towards the $58,500 level and traded to a new weekly high at $58,615. It is now correcting lower and trading below the $58,000 level. There was also a break below the 23.6% Fib retracement level of the upward wave from the $54,950 swing low to $58,615 high.
It seems like there is a key bullish flag pattern forming with resistance near $57,700 on the hourly chart of the BTC/USD pair. The channel support is near the $56,800 level.
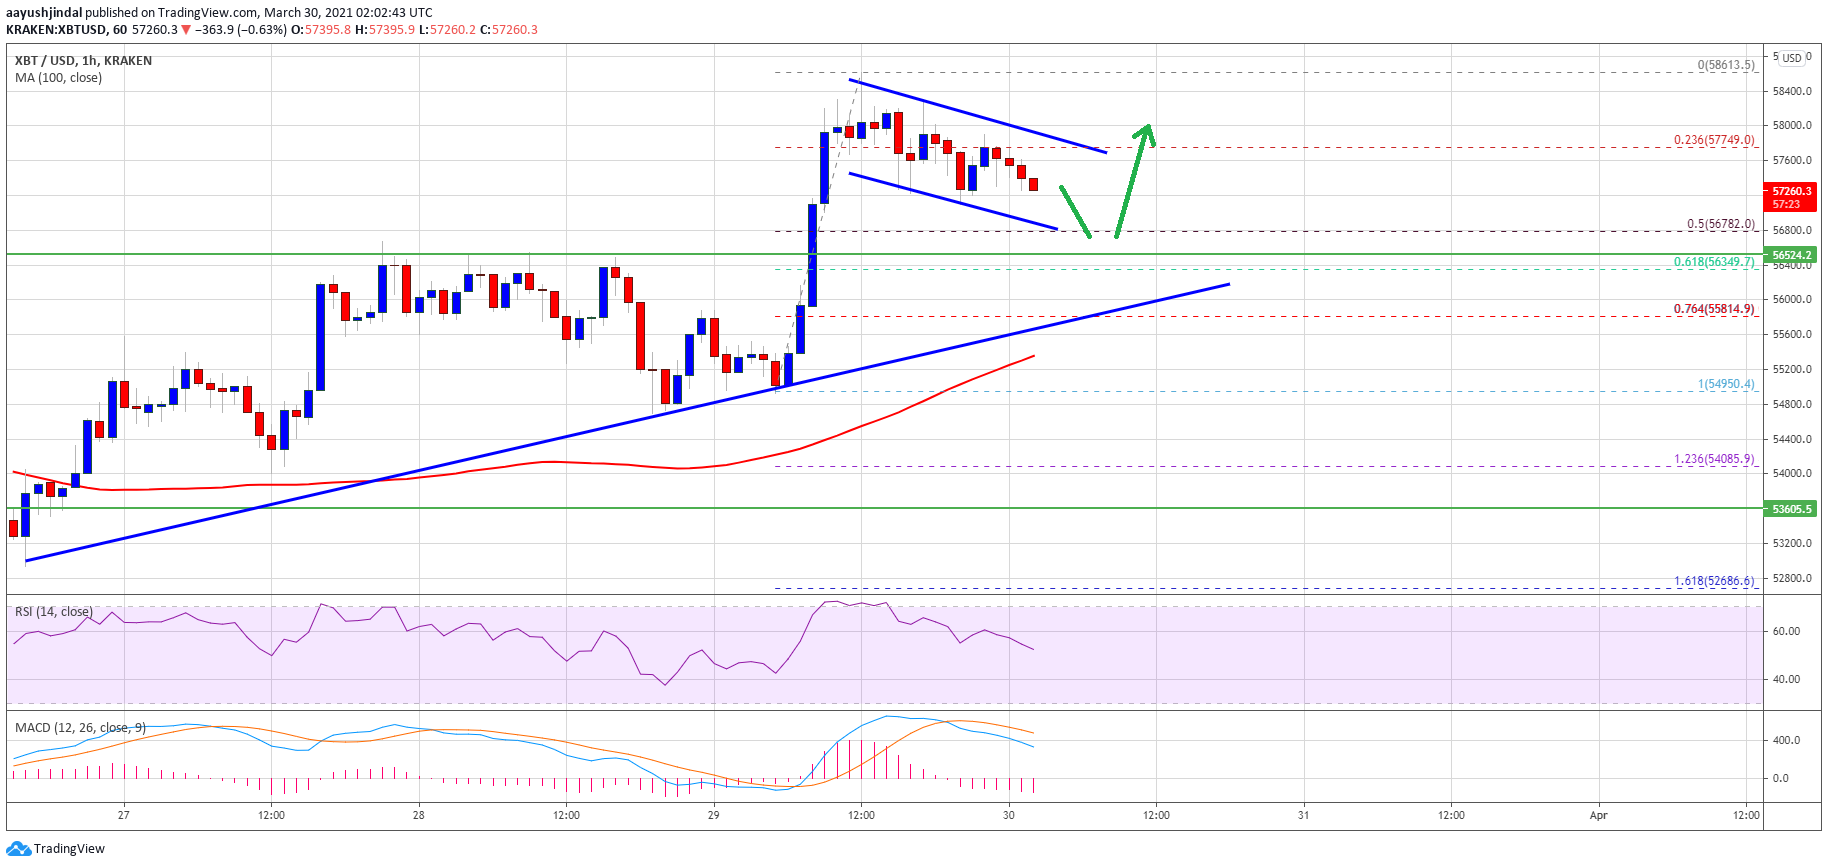
Source: BTCUSD on TradingView.com
The 50% Fib retracement level of the upward wave from the $54,950 swing low to $58,615 high is also close to the channel support. On the upside, a clear break above the flag resistance near $57,700 could open the doors for a fresh increase.
The next key resistance is near the $58,500 level. A convincing break above the $58,500 resistance is likely to set the pace for a move towards the $60,000 level.
Downward Move in BTC?
If bitcoin fails to climb above $57,700 and $58,000, there could be a downside correction. As stated, the $56,500 level is a decent support zone.
The next major support is near the $56,000 level and a connecting bullish trend line. Any more losses might call for a drop towards the $55,000 support zone in the near term.
Technical indicators:
Hourly MACD – The MACD is slowly losing momentum in the bullish zone.
Hourly RSI (Relative Strength Index) – The RSI for BTC/USD is approaching the 50 level.
Major Support Levels – $56,500, followed by $56,000.
Major Resistance Levels – $57,700, $58,500 and $60,000.


