Reason to trust
How Our News is Made
Strict editorial policy that focuses on accuracy, relevance, and impartiality
Ad discliamer
Morbi pretium leo et nisl aliquam mollis. Quisque arcu lorem, ultricies quis pellentesque nec, ullamcorper eu odio.
Bitcoin price recovered further and surged above the $38,000 resistance against the US Dollar. BTC even spiked above $40,000 and it is likely preparing for more upsides.
- Bitcoin remained well bid and it managed to climb above the 38,000 and $38,500 resistance levels.
- The price is now trading nicely above the $38,500 level and the 100 hourly simple moving average.
- There is a key contracting triangle forming with resistance near $39,425 on the hourly chart of the BTC/USD pair (data feed from Kraken).
- The pair could surge again if it clears the $39,400 and $39,500 resistance levels in the near term.
Bitcoin Price Gains Traction
After a successful break and a follow up move above $36,000, bitcoin price started a strong increase. BTC broke a couple of key hurdles near the $38,000 level to move further into a bullish zone.
The price gained pace and broke the $39,200 resistance. It even spiked above the $40,000 resistance and settled above the 100 hourly simple moving average. A high is formed near the $40,212 level and the price is currently consolidating gains.
It corrected below the $39,500 and $39,200 levels. A low is formed near $38,052 level and the price is currently forming a breakout pattern. It climbed above the 50% Fib retracement level of the recent decline from the $40,212 high to $38,052 low.
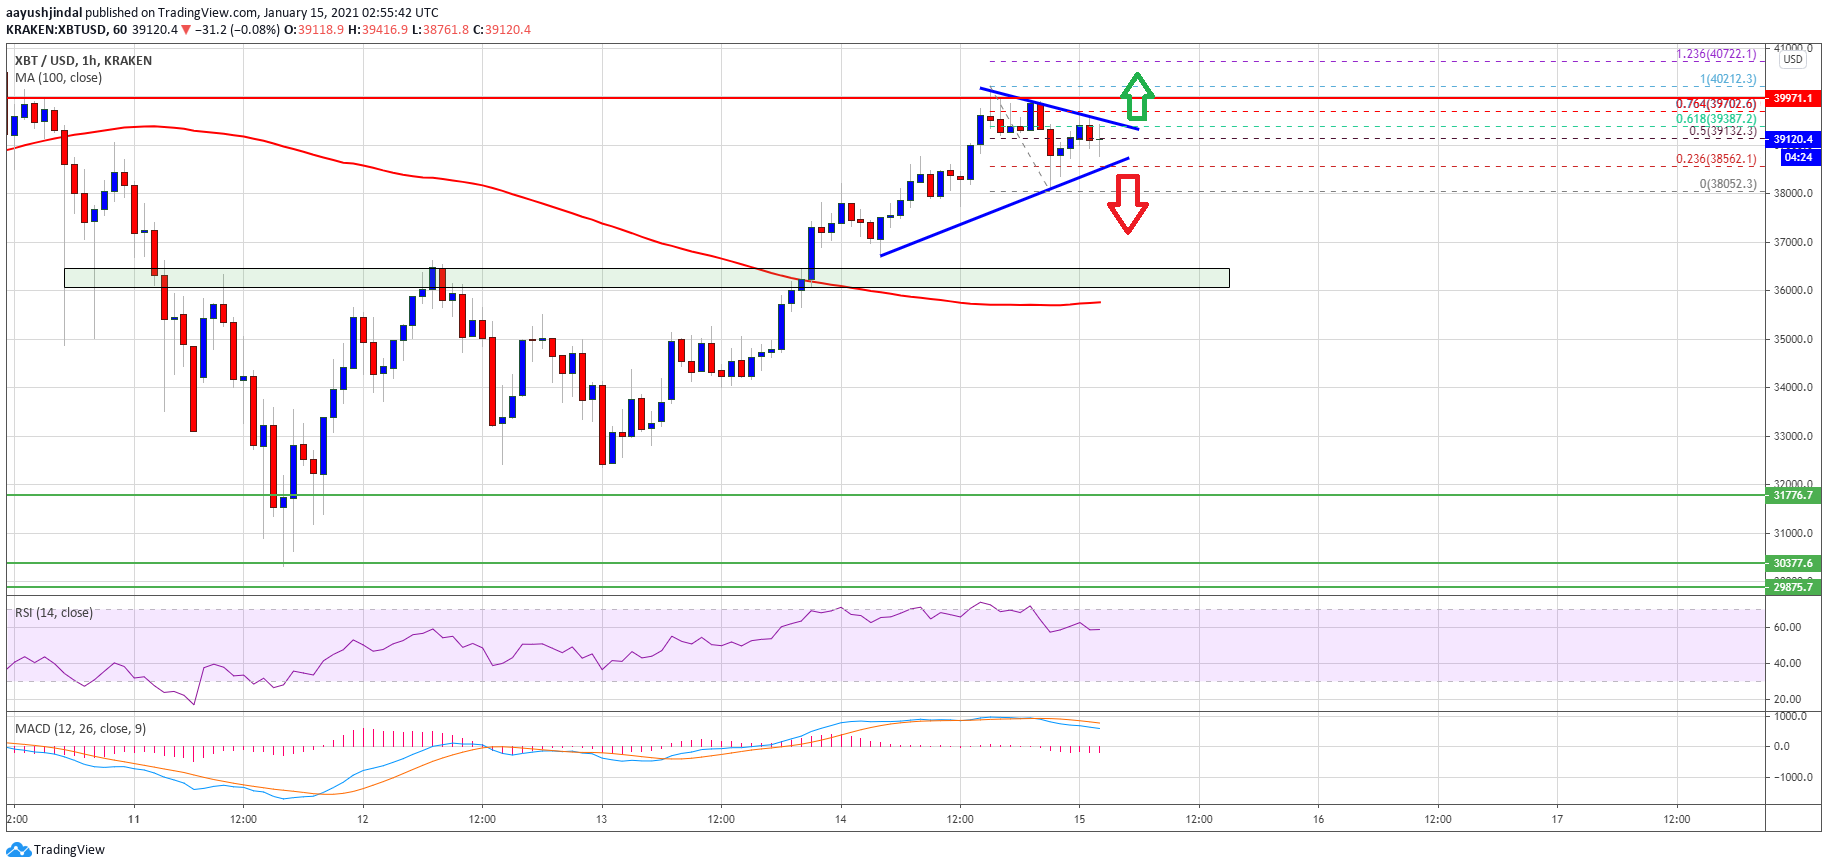
It seems like there is a key contracting triangle forming with resistance near $39,425 on the hourly chart of the BTC/USD pair. The triangle resistance is close to the 61.8% Fib retracement level of the recent decline from the $40,212 high to $38,052 low.
If there is a clear upside break above the triangle resistance, the price could clear the $40,000 level. In the stated case, bitcoin price might aim a strong surge and the bulls are likely to aim a new all-time high in the coming sessions.
Fresh Dip in BTC?
If bitcoin fails to clear the triangle resistance and $40,000, there is a risk of a fresh decline. An initial support is near the $38,500 level.
A downside break below the $38,500 and $38,000 support levels may possibly push the price towards the main $36,000 support zone in the near term.
Technical indicators:
Hourly MACD – The MACD is slowly losing momentum in the bullish zone.
Hourly RSI (Relative Strength Index) – The RSI for BTC/USD is moving lower towards the 50 level.
Major Support Levels – $38,500, followed by $36,000.
Major Resistance Levels – $39,450, $40,000 and $41,800.