
Reason to trust
How Our News is Made
Strict editorial policy that focuses on accuracy, relevance, and impartiality
Ad discliamer
Morbi pretium leo et nisl aliquam mollis. Quisque arcu lorem, ultricies quis pellentesque nec, ullamcorper eu odio.
Bitcoin price started a fresh upward move from the $44,000 zone against the US Dollar. BTC traded to a new all-time high near $48,680 and it is likely to continue higher towards $50,000.
- Bitcoin is showing a lot of positive signs above the $46,000 and $47,500 resistance levels.
- The price is trading above the $48,000 resistance and the 100 hourly simple moving average.
- There is a key contracting triangle pattern forming with support near $47,000 on the hourly chart of the BTC/USD pair (data feed from Kraken).
- The pair is likely to continue higher towards the $50,000 level as long as it is above $47,000.
Bitcoin Price is Eyeing More Upsides
After correcting lower towards the $44,000 level, bitcoin price started a fresh upward move. BTC broke the $46,000 resistance level and remained stable above the 100 hourly simple moving average.
As a result, the bulls were able to push the price above the $47,000 and $47,500 resistance levels. The price is now trading nicely above $48,000 and it even carved a new all-time high at $48,680. It is now consolidating gains above the $48,000 level.
An initial support is near the $47,570 level. It is close to the 23.6% Fib retracement level recent wave from the $44,005 swing low to $48,680 high. There is also a key contracting triangle pattern forming with support near $47,000 on the hourly chart of the BTC/USD pair.
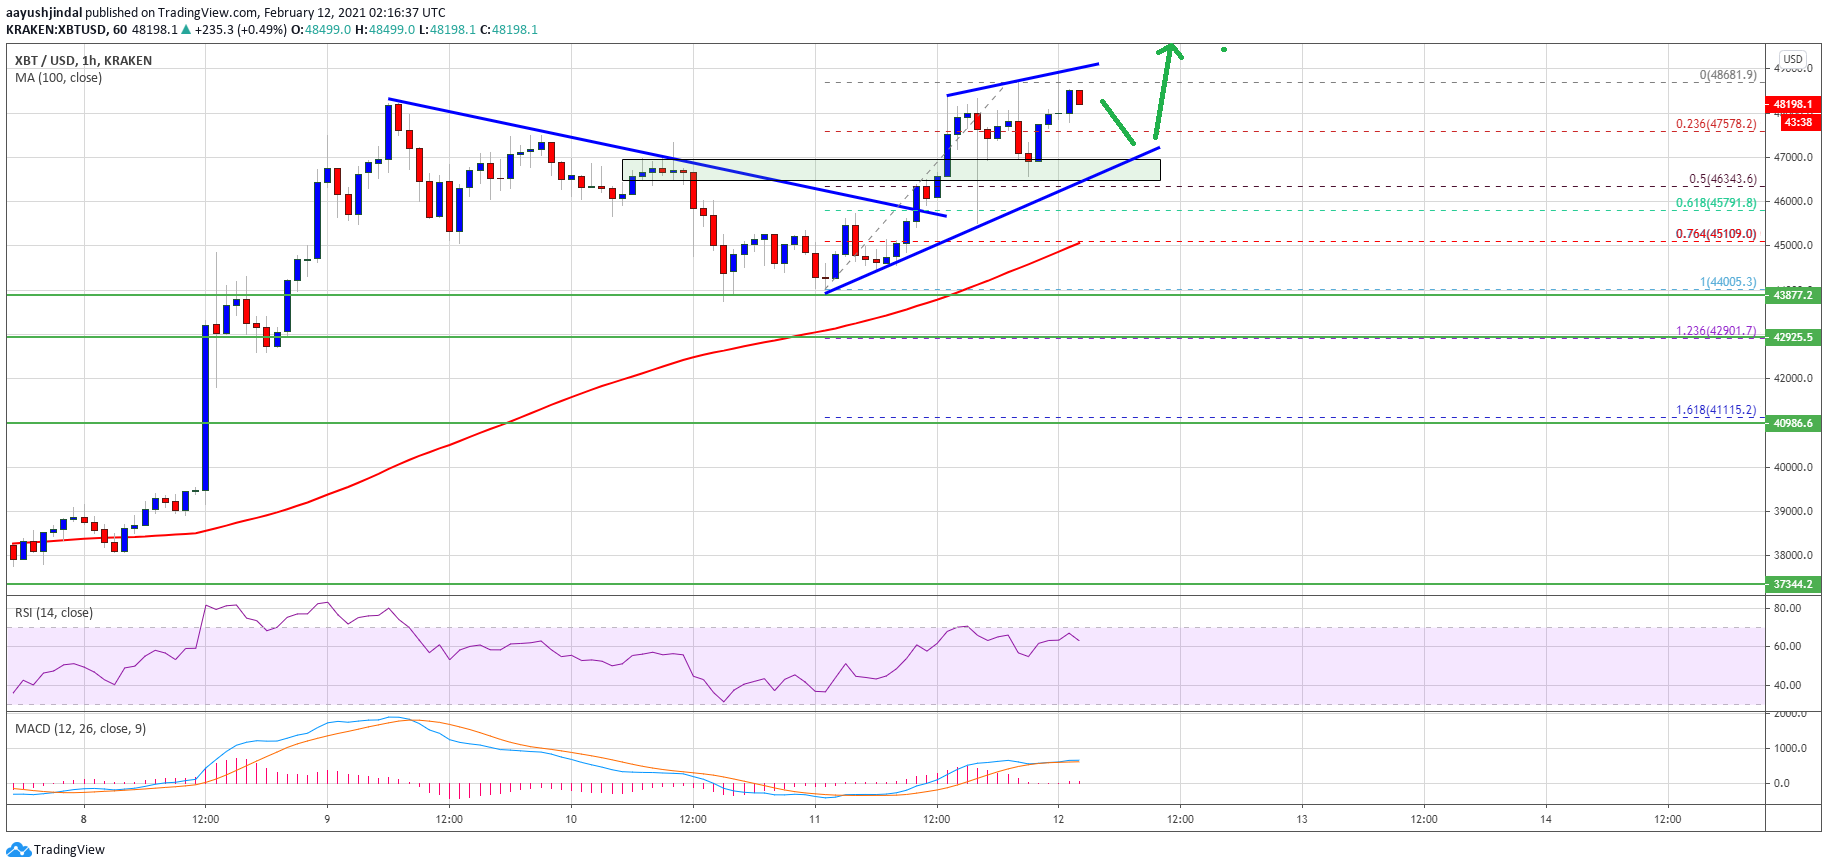
The triangle support is close to the 50% Fib retracement level recent wave from the $44,005 swing low to $48,680 high. On the upside, the $48,500 region is a short-term resistance. The next key resistance might be near the $49,400 level. The overall price action suggests that bitcoin bulls might aim a test of $50,000 in the near term.
Dips Limited in BTC?
If bitcoin fails to continue higher, it could correct lower below the $47,500 level. The first major support is near the $47,000 level and the triangle lower trend line.
The main support is now forming near the $45,000 level or the 100 hourly simple moving average. Any more losses could open the doors for a drop below the $44,000 support in the near term.
Technical indicators:
Hourly MACD – The MACD is slowly gaining momentum in the bullish zone.
Hourly RSI (Relative Strength Index) – The RSI for BTC/USD is now above the 50 level.
Major Support Levels – $47,000, followed by $45,000.
Major Resistance Levels – $48,500, $49,400 and $50,000.


