
Reason to trust
How Our News is Made
Strict editorial policy that focuses on accuracy, relevance, and impartiality
Ad discliamer
Morbi pretium leo et nisl aliquam mollis. Quisque arcu lorem, ultricies quis pellentesque nec, ullamcorper eu odio.
Bitcoin price started a downside correction after trading to a new all-time high near $48,308 against the US Dollar. BTC is now consolidating gains and it is likely to continue higher above $47,000.
- Bitcoin traded to a new all-time high at $48,308 before correcting lower.
- The price is now well above $45,500 and the 100 hourly simple moving average.
- There is a new contracting triangle pattern forming with resistance near $47,050 on the hourly chart of the BTC/USD pair (data feed from Kraken).
- The pair is likely to continue higher once it clears the $47,000 and $47,100 levels.
Bitcoin Price Remains Supported
There was a nasty increase in bitcoin price above the $45,000 resistance level. BTC even broke the $47,000 level and traded to a new all-time high at $48,308.
Recently, there was a downside correction below the $47,000 level. The price even traded below the $46,000 level, but it remained stable above $45,000. A low was formed near $45,084 before the price recovered higher.
It is now well above $45,500 and the 100 hourly simple moving average. There was a break above the 50% Fib retracement level recent decline from the $48,308 high to $45,084 low. There is also a new contracting triangle pattern forming with resistance near $47,050 on the hourly chart of the BTC/USD pair.
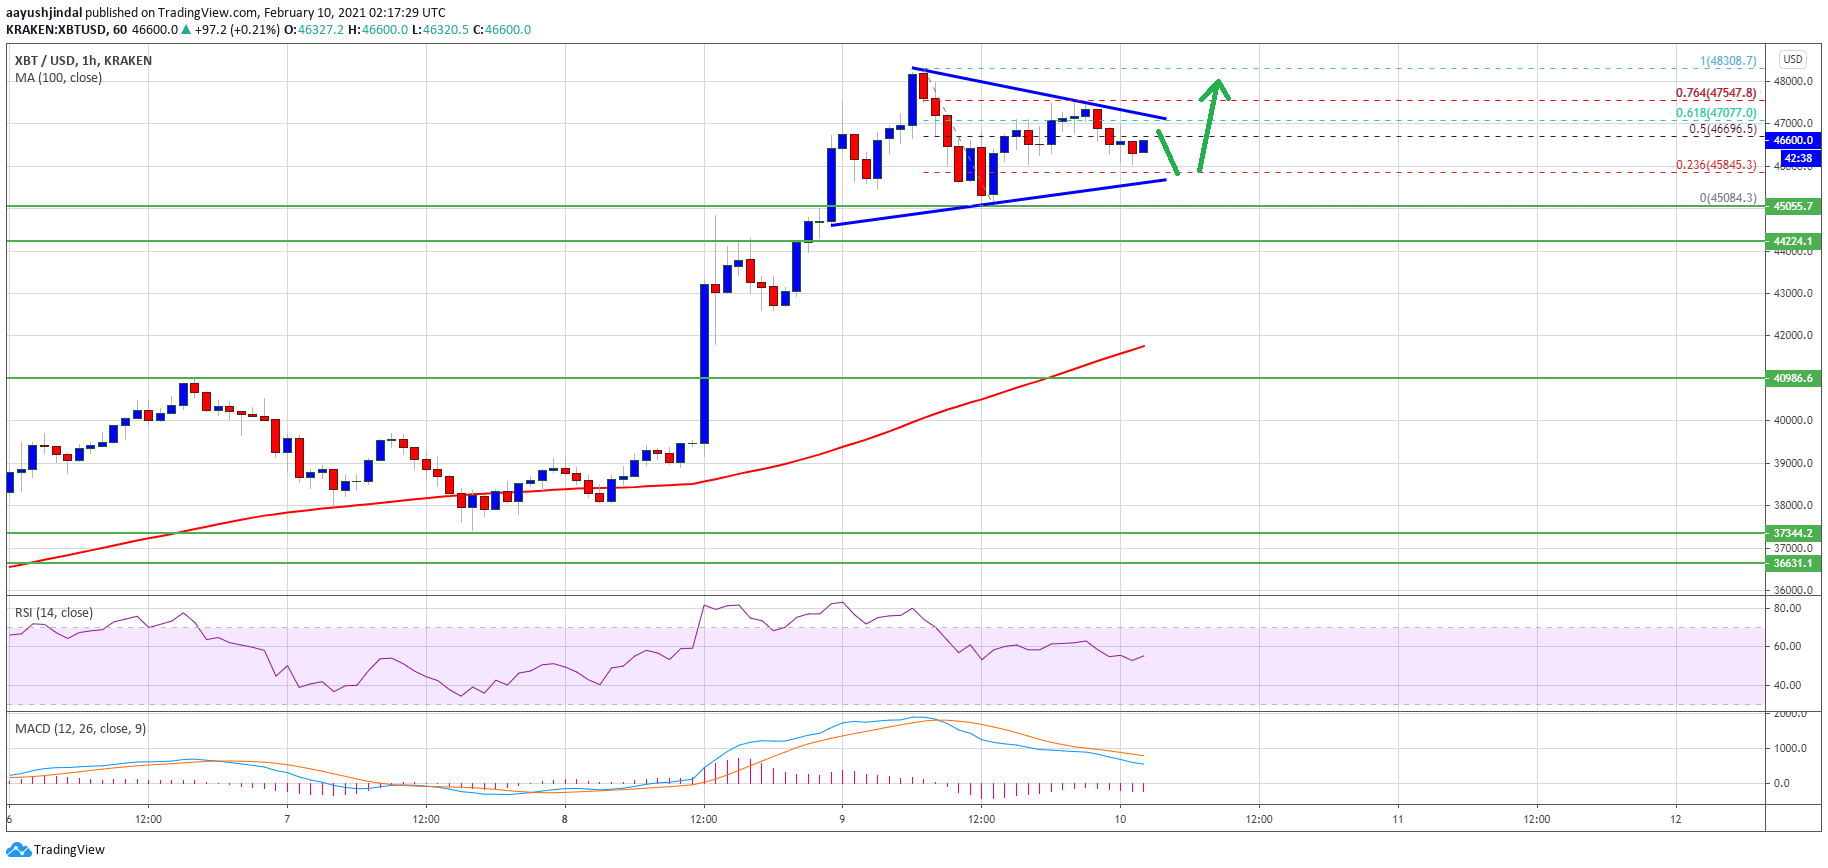
Source: BTCUSD on TradingView.com
The triangle resistance is close to the 61.8% Fib retracement level recent decline from the $48,308 high to $45,084 low. If there is a clear break above the triangle resistance, there are chances of a steady increase above $47,500. The next major resistance is near the $48,000 level. Any more gains could open the doors for a push towards the $50,000 level.
Dips Supported in BTC?
If bitcoin fails to continue higher, it could correct lower towards the $46,000 level. The next major support is near the $45,800 level and the triangle lower trend line.
A downside break below the triangle support could push the price towards the $48,000 support level. Any more losses below the $45,000 may possibly lead the price towards the $43,200 support level in the near term.
Technical indicators:
Hourly MACD – The MACD is slowly losing momentum in the bearish zone.
Hourly RSI (Relative Strength Index) – The RSI for BTC/USD is still well above the 50 level.
Major Support Levels – $45,800, followed by $45,000.
Major Resistance Levels – $47,000, $47,100 and $48,000.


