
Reason to trust
How Our News is Made
Strict editorial policy that focuses on accuracy, relevance, and impartiality
Ad discliamer
Morbi pretium leo et nisl aliquam mollis. Quisque arcu lorem, ultricies quis pellentesque nec, ullamcorper eu odio.
Bitcoin price formed a new yearly high close to $20,000 before correcting lower against the US Dollar. BTC could accelerate its decline if there is a clear break below the 100 hourly SMA.
- Bitcoin is currently correcting lower below the $19,500 and $19,000 levels.
- The price is approaching a key support at $18,350 and the 100 hourly simple moving average.
- There is a major bearish trend line forming with resistance near $18,800 on the hourly chart of the BTC/USD pair (data feed from Kraken).
- The pair could decline heavily if it fails to stay above the 100 hourly SMA and $18,200.
Bitcoin Price is Grinding Lower
There was an upside extension in bitcoin price above the $19,500 resistance. BTC even surpassed the previous swing high and traded close to the $20,000 barrier. However, there was no test of $20,000 and the price reacted to the downside.
There was a sharp decline of more than 5% and the price traded below the $19,000 level. Bitcoin found support near the $18,100 level and the 100 hourly simple moving average. A swing low was formed near $18,111 before the price corrected higher.
There was a recovery above $19,000, but the bears protected the $19,500 zone. A high is formed near $19,512 and the price is currently declining. It is trading below the 50% Fib retracement level of the recent recovery from the $18,111 swing low to $19,512 high.
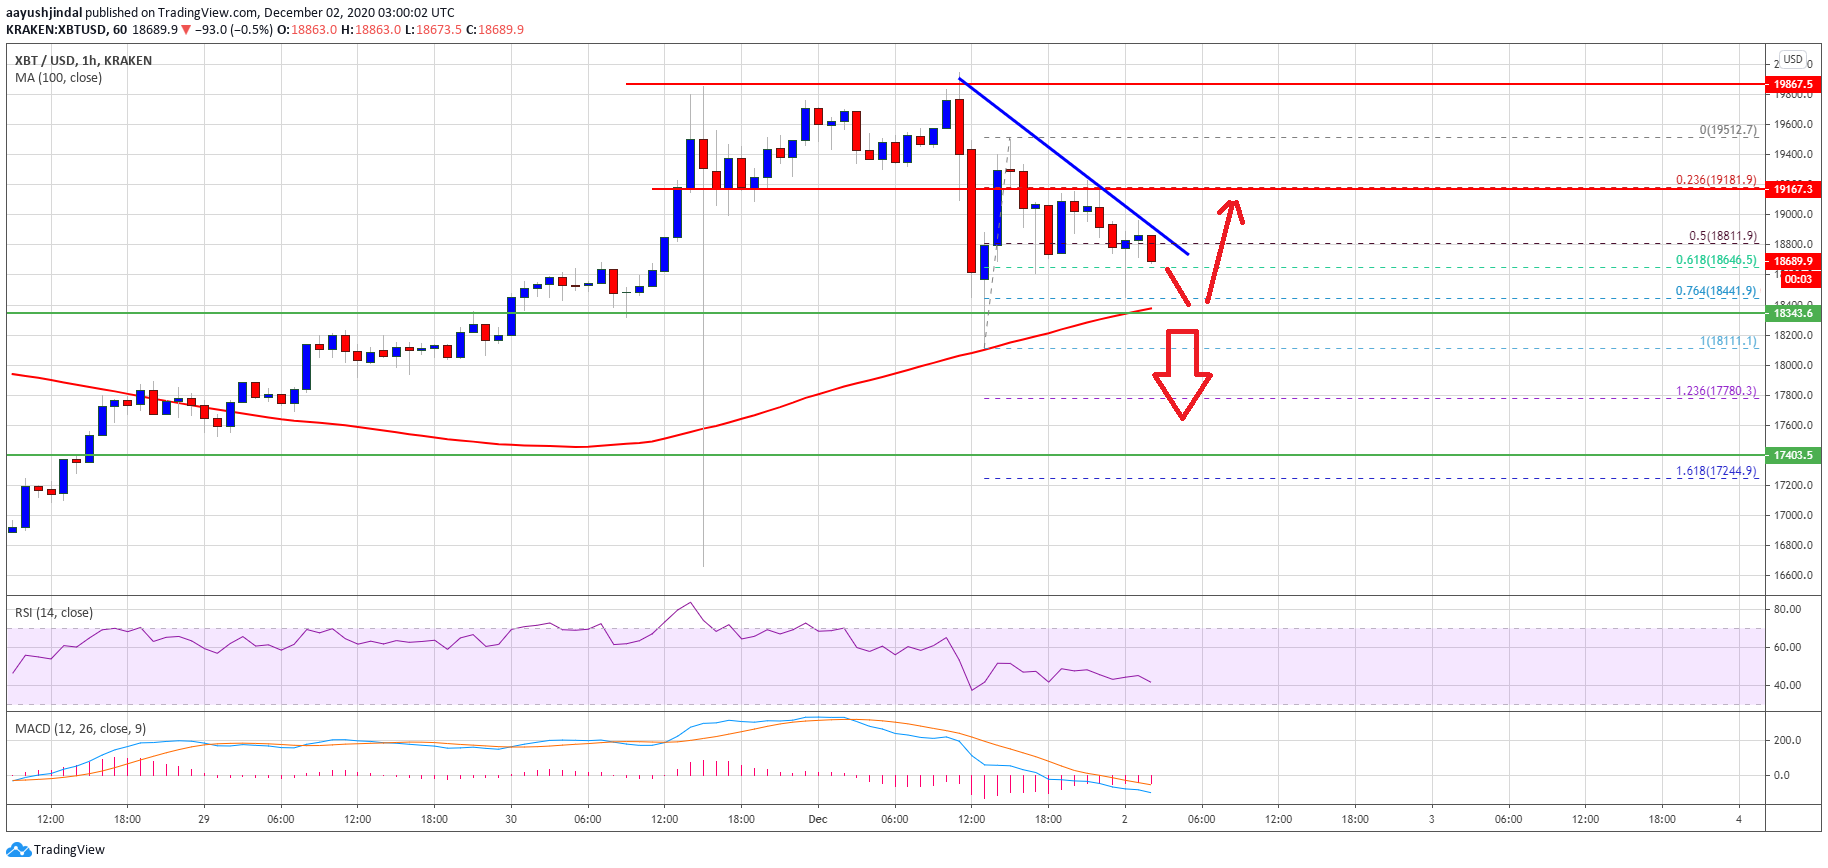
Source: BTCUSD on TradingView.com
It seems like there is major bearish trend line forming with resistance near $18,800 on the hourly chart of the BTC/USD pair. On the downside, the price is approaching a key support at $18,350 and the 100 hourly simple moving average.
The 76.4% Fib retracement level of the recent recovery from the $18,111 swing low to $19,512 high is also near $18,400. A downside break below the $18,350 support and the 100 hourly SMA could spark a larger decline. The next major support could be $18,000 or $17,850.
Fresh Increase in BTC?
If bitcoin remains stable above the $18,350 support and the 100 hourly simple moving average, it could attempt a fresh increase. An initial hurdle for the bulls is near the trend line and $18,800.
The first major resistance is near the $19,000 level. A clear break above the $19,000 level could pump the price towards the $19,500 resistance level.
Technical indicators:
Hourly MACD – The MACD is slowly losing momentum in the bearish zone.
Hourly RSI (Relative Strength Index) – The RSI for BTC/USD is currently moving higher towards the 50 level.
Major Support Levels – $18,350, followed by $18,000.
Major Resistance Levels – $18,800, $19,200 and $19,500.


