Reason to trust
How Our News is Made
Strict editorial policy that focuses on accuracy, relevance, and impartiality
Ad discliamer
Morbi pretium leo et nisl aliquam mollis. Quisque arcu lorem, ultricies quis pellentesque nec, ullamcorper eu odio.
Bitcoin price traded to a new multi-month high near $15,970 before correcting lower against the US Dollar. BTC is holding the $14,500 support and it could start another rally.
- Bitcoin started a sharp downside correction after trading close to the $16,000 resistance.
- The price corrected lower below $15,000, but it is still well above the 100 simple moving average (4-hours).
- There is a major contracting triangle forming with resistance near $15,250 on the 4-hours chart of the BTC/USD pair (data feed from Kraken).
- The pair could resume its rally once it clears the $15,250 and $15,300 resistance levels.
Bitcoin Price is Holding Key Support
This past week, bitcoin started a strong surge above the $14,500 and $15,000 resistance levels against the US Dollar. The BTC/USD pair even rallied above $15,500 and settled well above the 100 simple moving average (4-hours).
It traded close to the $16,000 level and formed a new multi-month high at $15,971 before starting a sharp downside correction. There was a break below the $15,500 support level.
Bitcoin price declined below the 50% Fib retracement level of the upward move from the $13,558 swing low to $15,971 high. However, the bulls were able to defend the $14,500 support zone and the price remained well above the 100 simple moving average (4-hours).
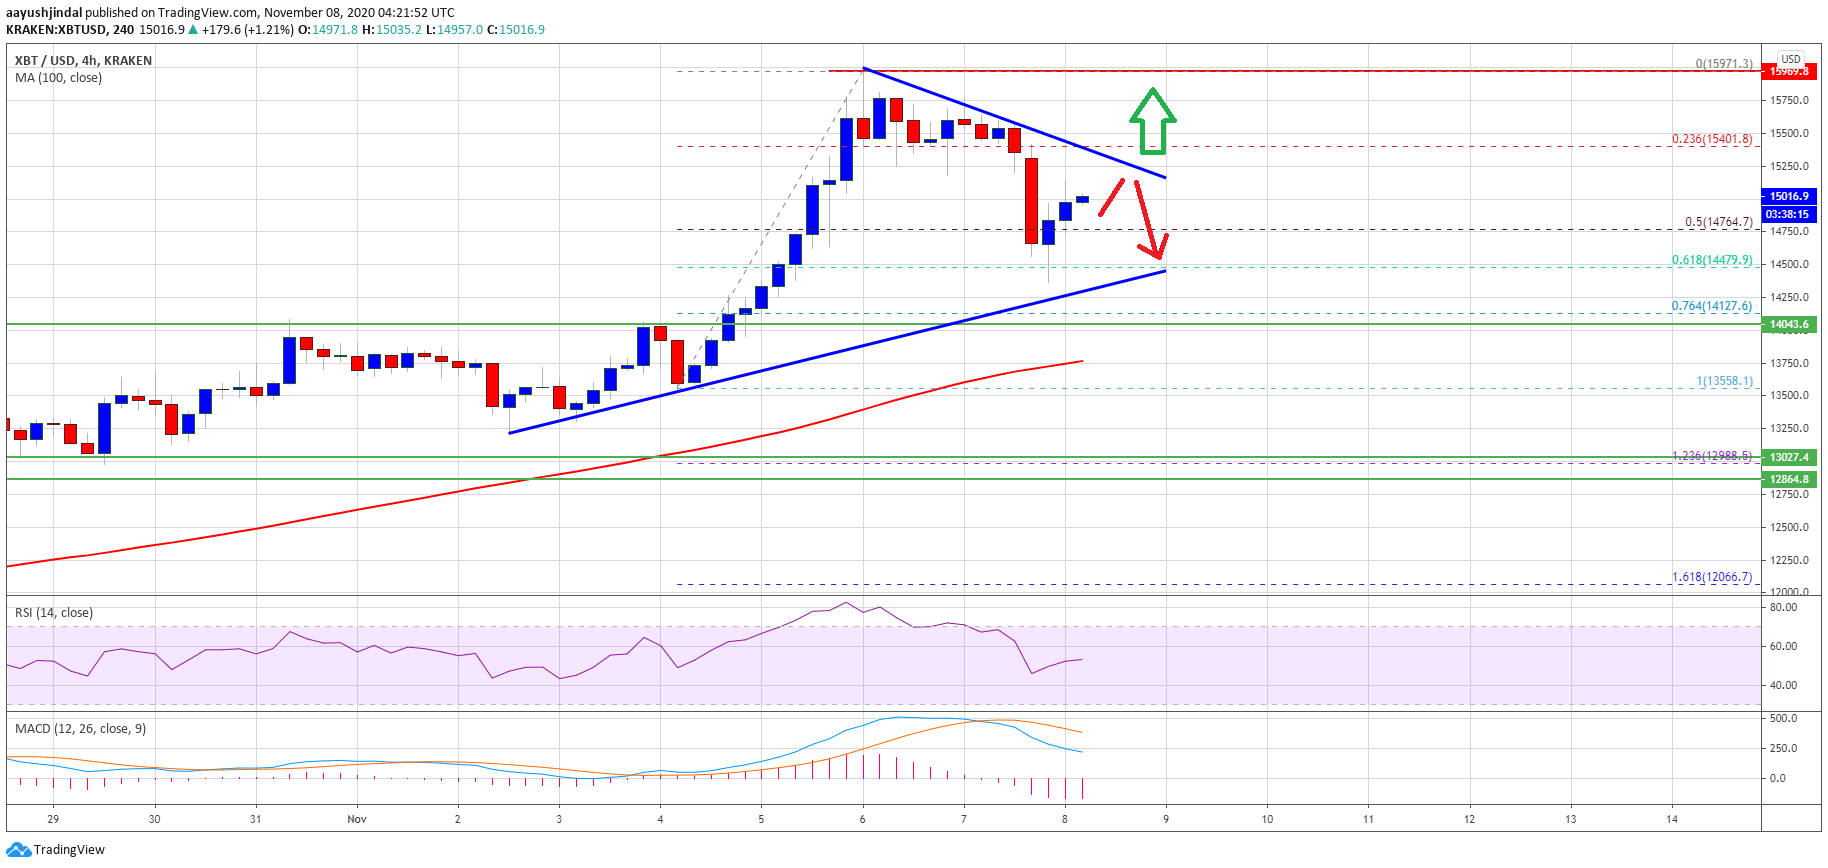
It also stayed above the 61.8% Fib retracement level of the upward move from the $13,558 swing low to $15,971 high. It seems like there is a major contracting triangle forming with resistance near $15,250 on the 4-hours chart of the BTC/USD pair.
To start a fresh rally, the price must break the triangle resistance zone and the $15,300 level. The next major resistance is near $15,500, above which the bulls are likely to aim a test of $16,000.
Downsides Could Be Limited in BTC
If bitcoin fails to clear triangle resistance, it could correct lower below $14,800. The first major support is near the triangle lower trend line and $14,500.
A clear break below the triangle support could lead the price towards the $14,000 support zone. The next major support is near the $13,750 level or the 100 simple moving average (4-hours).
Technical indicators
4 hours MACD – The MACD for BTC/USD is slowly losing pace in the bearish zone.
4 hours RSI (Relative Strength Index) – The RSI for BTC/USD is back above the 50 level.
Major Support Level – $14,500
Major Resistance Level – $15,300