
Reason to trust
How Our News is Made
Strict editorial policy that focuses on accuracy, relevance, and impartiality
Ad discliamer
Morbi pretium leo et nisl aliquam mollis. Quisque arcu lorem, ultricies quis pellentesque nec, ullamcorper eu odio.
Bitcoin price is showing positive signs above $55,000 against the US Dollar. BTC is likely to surpass $58,000 and trade to a new all-time high in the near term.
- Bitcoin climbed further above the $55,500 and $57,000 resistance levels.
- The price is now consolidating above $55,000 and it is well above the 100 hourly simple moving average.
- There is a major bullish trend line forming with support near $55,150 on the hourly chart of the BTC/USD pair (data feed from Kraken).
- The pair is likely to accelerate higher above $57,500 and $58,000 in the coming sessions.
Bitcoin Price is Showing Positive Signs
There was a steady rise in bitcoin above the $55,000 resistance zone. BTC climbed above the $56,000 level and it settled well above the 100 hourly simple moving average.
The bulls even pushed the price above the $57,000 resistance. A high is formed near $57,367 and the price is currently correcting lower. It traded below the 23.6% Fib retracement level of the upward move from the $53,002 low to $57,367 high.
Bitcoin is testing the $55,500 support level and it is still well above the 100 hourly simple moving average. The next major support is near the $52,150 level. There is also a major bullish trend line forming with support near $55,150 on the hourly chart of the BTC/USD pair.
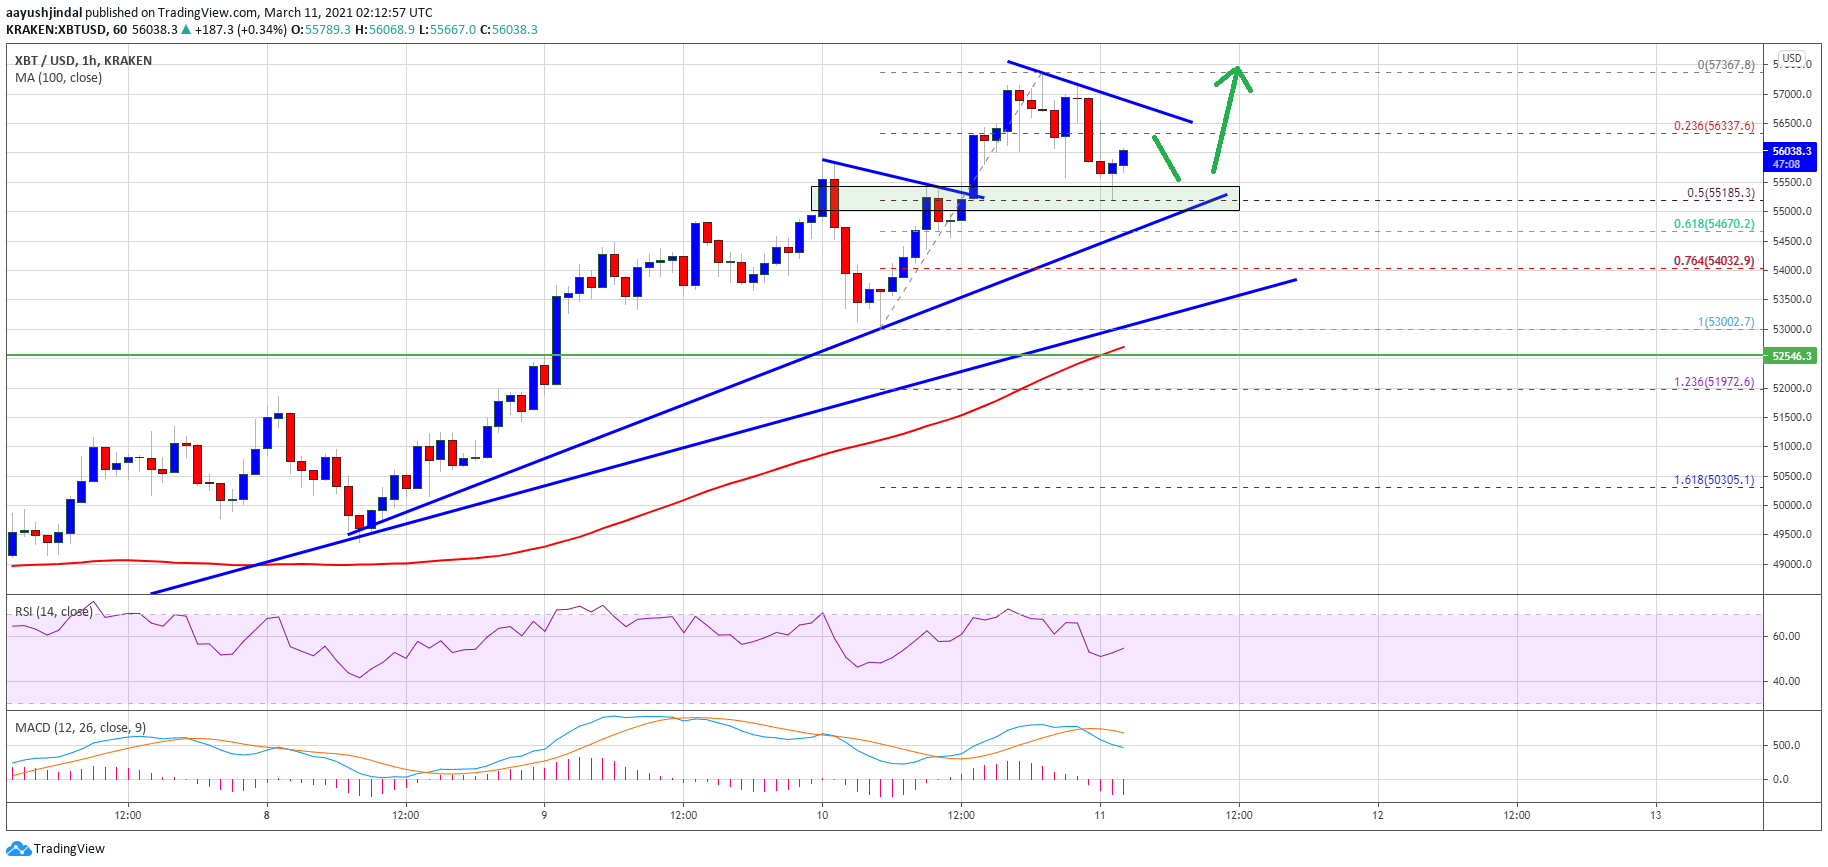
Source: BTCUSD on TradingView.com
The trend line is close to the 50% Fib retracement level of the upward move from the $53,002 low to $57,367 high. On the upside, the $56,500 level is a short-term hurdle. There is also a connecting bearish trend line at $56,500 on the same chart.
A clear break above the trend line resistance and $57,500 could open the doors for a move towards the $58,000 level. The next aim for the bulls could be a new all-time high or even $60,000.
Dips Supported in BTC?
If bitcoin fails to clear the $57,500 resistance, it could correct further lower. The first key support is near the trend line and $55,150.
If there is a downside break below the trend line support, there are chances of a move towards the $54,000 support. There is another trend line forming with support near $54,000 on the same chart.
Technical indicators:
Hourly MACD – The MACD is slowly losing momentum in the bearish zone.
Hourly RSI (Relative Strength Index) – The RSI for BTC/USD is still above the 50 level.
Major Support Levels – $55,150, followed by $54,000.
Major Resistance Levels – $57,500, $58,000 and $60,000.


