Reason to trust
How Our News is Made
Strict editorial policy that focuses on accuracy, relevance, and impartiality
Ad discliamer
Morbi pretium leo et nisl aliquam mollis. Quisque arcu lorem, ultricies quis pellentesque nec, ullamcorper eu odio.
Bitcoin price started a steady upward move from the $17,500 support zone against the US Dollar. BTC is currently attempting an upside break and it could rally above $19,000.
- Bitcoin is trading in a positive zone above the $18,500 and $18,200 support levels.
- The price is now facing hurdles near the $19,000 level, but it is above the 100 simple moving average (4-hours).
- There is a key contracting triangle forming with resistance near $18,900 on the 4-hours chart of the BTC/USD pair (data feed from Kraken).
- The pair could start a strong rally if there is a close above $18,900 and $19,000.
Bitcoin Price is Attempting Upside Break
After a steady decline, bitcoin price found support near the $17,500 zone against the US Dollar. The BTC/USD pair traded as low as $17,572 before it started a steady upward move and a recovery wave.
The bulls gained strength after the price broke the $18,000 resistance level. There was also a break above the 50% Fib retracement level of the downward move from the $19,445 swing high to $17,572 swing low. The price even broke the $18,500 resistance level.
Bitcoin is now facing hurdles near the $19,000 level, but it is above the 100 simple moving average (4-hours). There is also a key contracting triangle forming with resistance near $18,900 on the 4-hours chart of the BTC/USD pair.
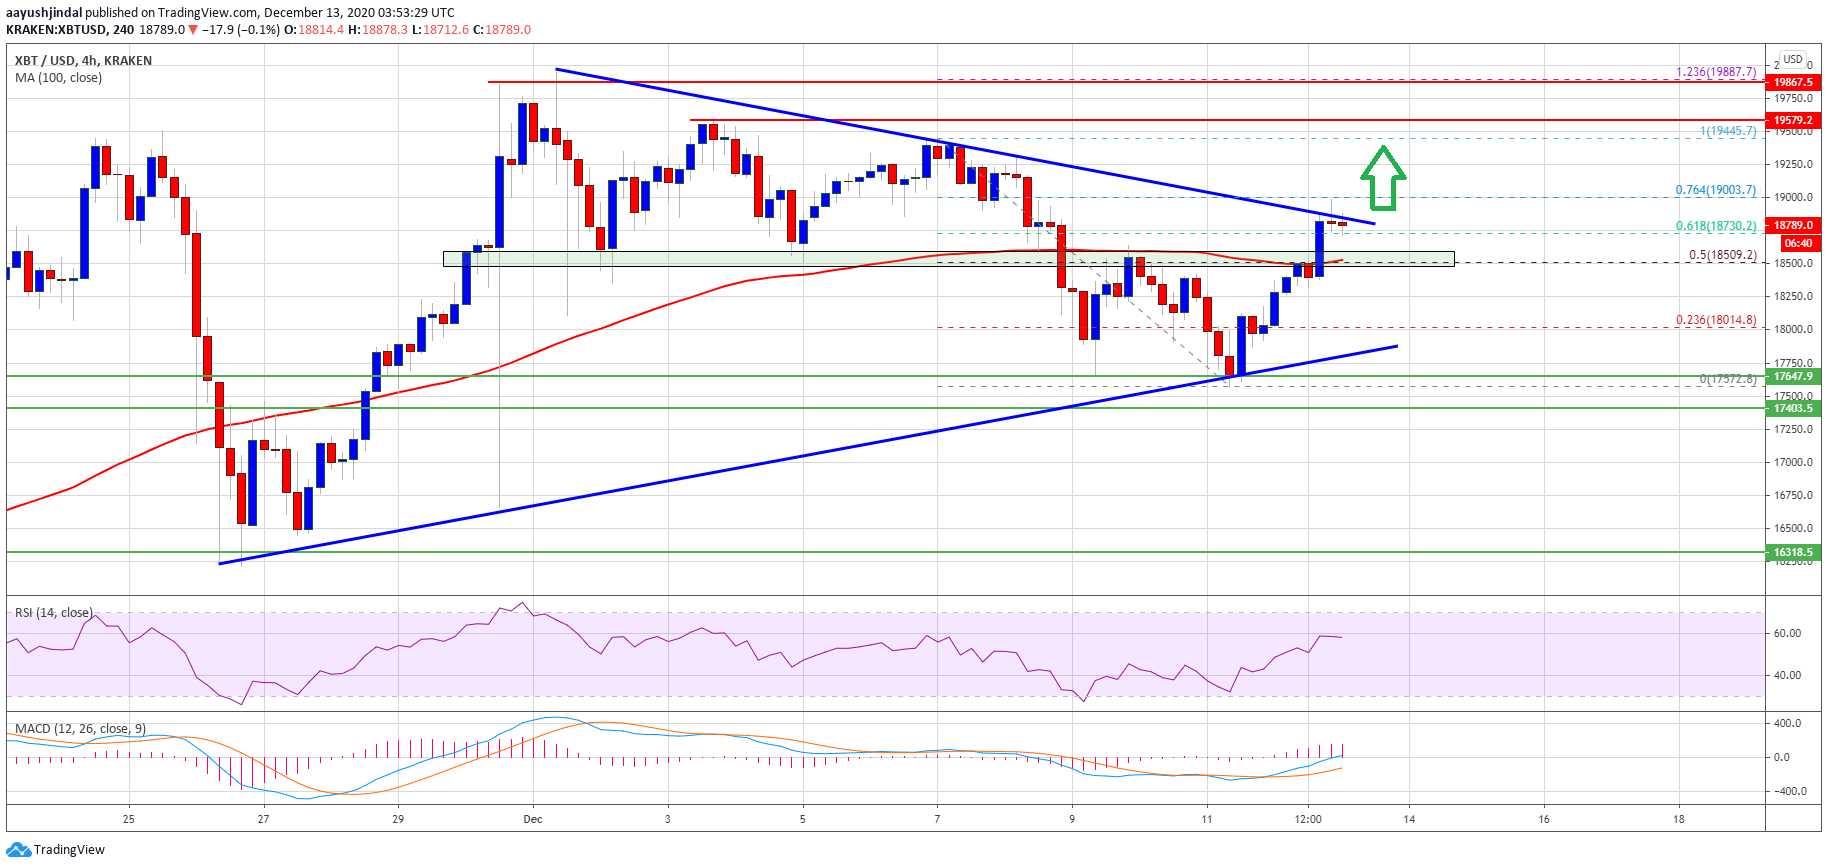
Source: BTCUSD on TradingView.com
If there is an upside break above the triangle resistance and $19,000, the price could rally sharply. The next major resistance is near the $19,500 level, above which the bulls might attempt an upside break above the $19,800 and $19,850 levels. The next major resistance sits near the $20,000 level.
Another Failure in BTC?
If bitcoin fails to clear the $18,900 and $19,000 resistance levels, it could start a fresh decline. An initial support is near the $18,500 level and the 100 simple moving average (4-hours).
The first major support below the 100 simple moving average (4-hours) is near the triangle lower trend line at $18,000. A close below the triangle support zone could open the doors for a fresh slide towards the $17,500 support zone in the near term.
Technical indicators
4 hours MACD – The MACD for BTC/USD is slowly gaining momentum in the bullish zone.
4 hours RSI (Relative Strength Index) – The RSI for BTC/USD is rising and it is above the 50 level.
Major Support Level – $18,500
Major Resistance Level – $19,000