
Reason to trust
How Our News is Made
Strict editorial policy that focuses on accuracy, relevance, and impartiality
Ad discliamer
Morbi pretium leo et nisl aliquam mollis. Quisque arcu lorem, ultricies quis pellentesque nec, ullamcorper eu odio.
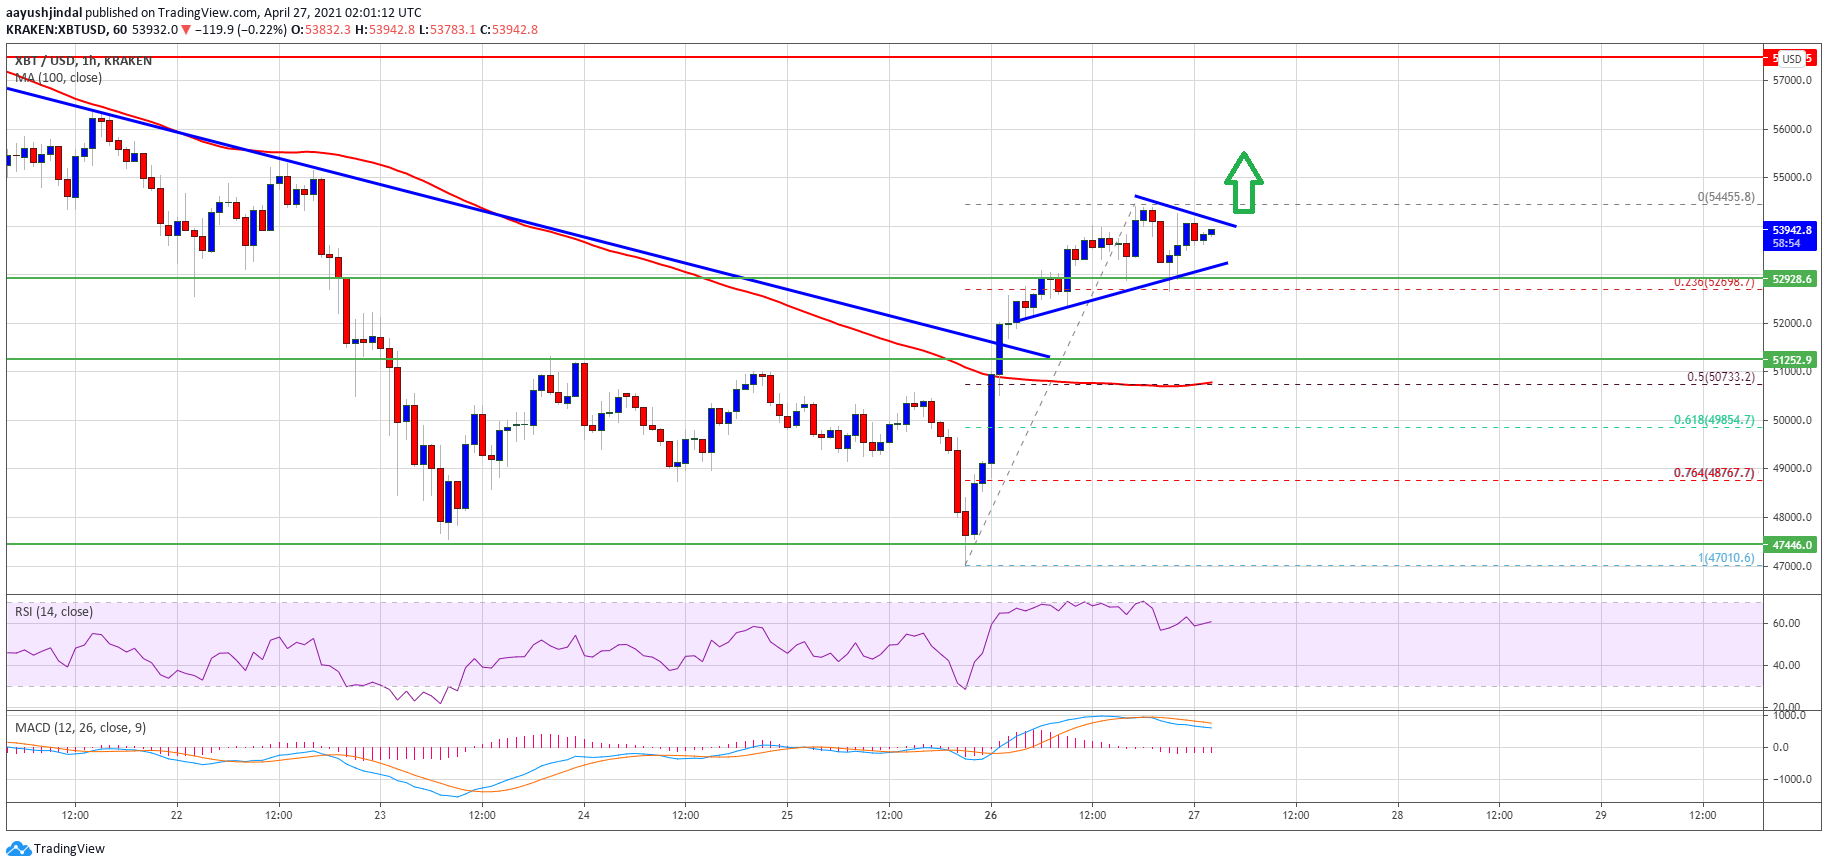
Bitcoin price gained pace and it cleared the $53,000 resistance zone against the US Dollar. BTC is consolidating and it seems ready for more gains above $54,000.
- Bitcoin remained well bid and it was able to clear the $53,000 resistance.
- The price is now trading well above $52,000 and the 100 hourly simple moving average.
- There is a key contracting triangle forming with resistance near $54,000 on the hourly chart of the BTC/USD pair (data feed from Kraken).
- The pair is likely to continue higher above the $54,000 and $54,500 resistance levels.
Bitcoin Price is Gaining Pace
Bitcoin remained well supported above the $51,000 level and it managed to extend gains. BTC gained bullish momentum above the $52,000 resistance and the 100 hourly simple moving average.
It even cleared the $53,000 and $53,500 resistance levels. A high is formed near $54,455 and the price is now consolidating gains. It already tested the $53,000 support level. The 23.6% Fib retracement level of the recent wave from the $47,010 swing low to $54,455 high is acting as a support.
It seems like there is a key contracting triangle forming with resistance near $54,000 on the hourly chart of the BTC/USD pair. The pair is now trading well above $52,000 and the 100 hourly simple moving average.
Source: BTCUSD on TradingView.com
If there is a clear break above the $54,000 resistance zone, the price is likely to accelerate higher. The next key resistance is near the $54,500 level, above which the doors could open for a run up towards the $58,000 barrier in the near term.
Dips Limited in BTC?
If bitcoin fails to clear the $54,500 and $55,000 resistance levels, it could start a downside correction. An immediate support on the downside is near the $53,000 level.
The first key support is near the $51,250 level. The 50% Fib retracement level of the recent wave from the $47,010 swing low to $54,455 high is also near the $50,700 level to act as a support. Moreover, the 100 hourly simple moving average is at $50,500 to act as a strong support in the near term.
Technical indicators:
Hourly MACD – The MACD is slowly gaining pace in the bullish zone.
Hourly RSI (Relative Strength Index) – The RSI for BTC/USD is now well above the 55 level.
Major Support Levels – $53,000, followed by $51,250.
Major Resistance Levels – $54,500, $55,000 and $58,000.


