Reason to trust
How Our News is Made
Strict editorial policy that focuses on accuracy, relevance, and impartiality
Ad discliamer
Morbi pretium leo et nisl aliquam mollis. Quisque arcu lorem, ultricies quis pellentesque nec, ullamcorper eu odio.
Bitcoin price formed a double top pattern near $19,500 and corrected lower against the US Dollar. BTC is now trading below $18,500 and it could test the $18,000 support or $17,600.
- Bitcoin failed again to clear the $19,500 resistance and started a sharp downside correction.
- The price declined sharply below the $19,000 level and the 100 hourly simple moving average.
- There was a break below a major bullish trend line with support near $19,000 on the hourly chart of the BTC/USD pair (data feed from Kraken).
- The pair is now approaching the $18,120 and $18,000 support levels.
Bitcoin Price Forms a Double Top
There was another attempt by bitcoin price to clear the $19,450 and $19,500 resistance levels, but it failed. A double top pattern was formed near the $19,500 level and there was a sharp decline in bitcoin price below the $19,000 support.
The price declined below many key supports near $19,000 and the 100 hourly simple moving average. There was also a break below a major bullish trend line with support near $19,000 on the hourly chart of the BTC/USD pair.
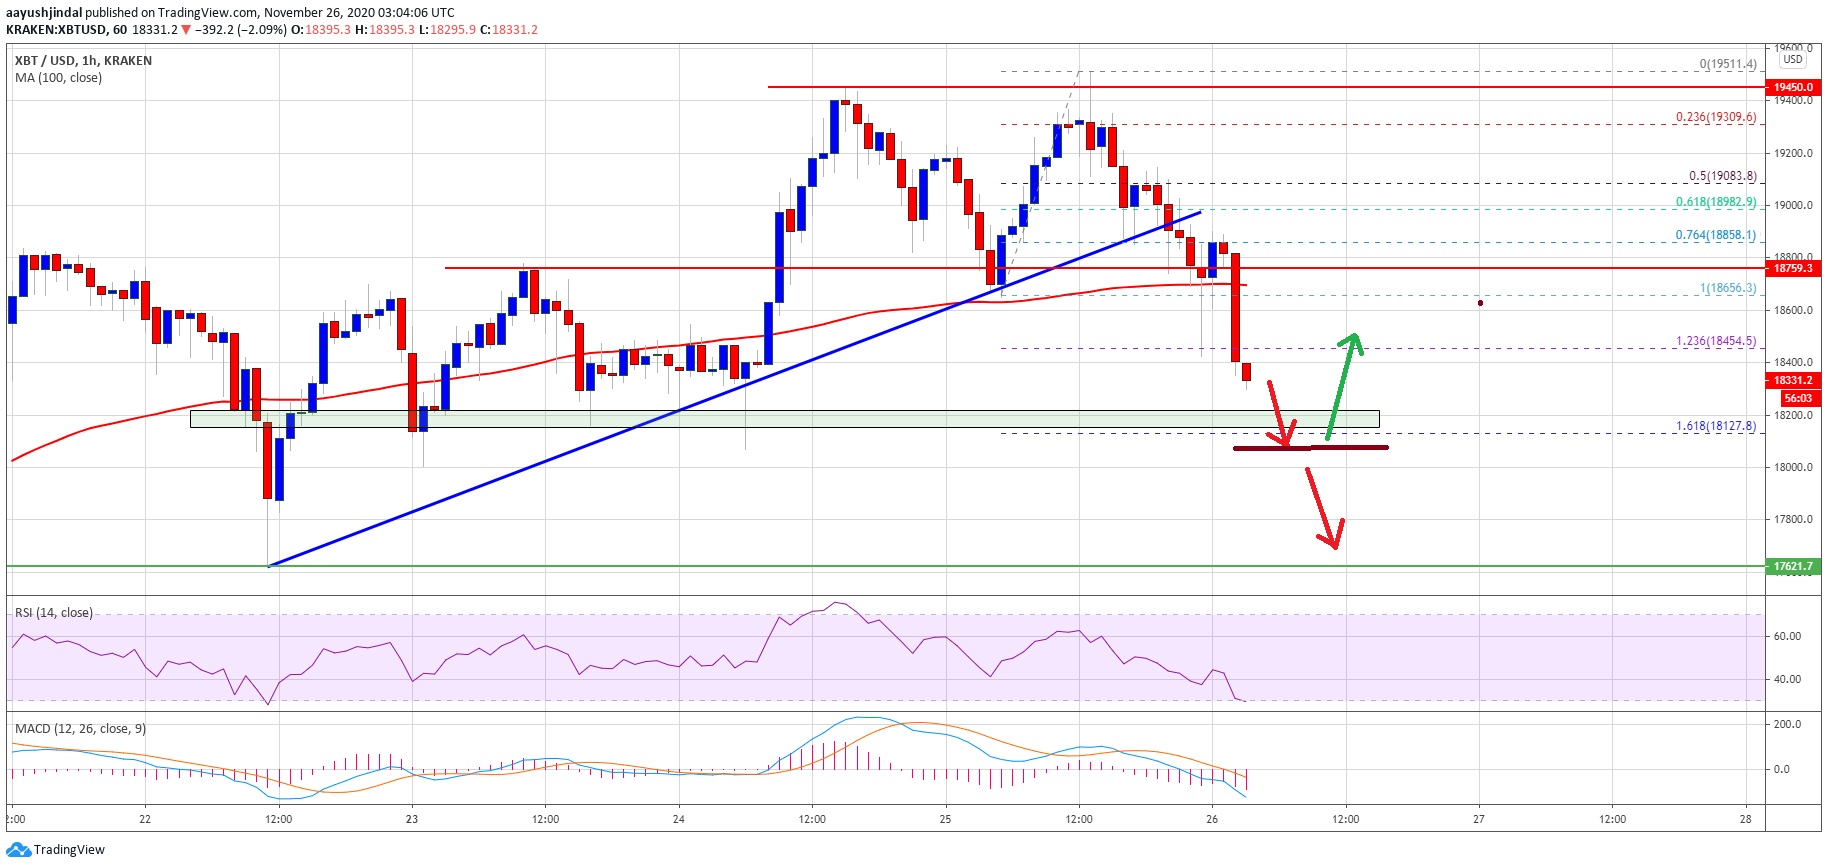
Bitcoin broke the last swing low at $18,656 and extended its decline below the $18,500 level. The bears pushed the price below the 1.236 Fib extension level of the upward move from the $18,656 swing low to $19,511 swing high.
It is now approaching the $18,100 support level. It is close to the 1.618 Fib extension level of the upward move from the $18,656 swing low to $19,511 swing high. If there are more downsides, the price could even break the $18,000 support level.
In the stated case, the price is likely to continue lower towards the $17,620 and $17,500 support levels in the coming sessions.
Recovery in BTC?
If bitcoin stays above the $18,100 and $18,000 support levels, there could be a fresh increase. An initial resistance is near the $18,500 level.
The first major resistance is forming near the $18,700 level and the 100 hourly simple moving average. The main resistance sits at $19,000, above which the price could rise towards the $19,500 resistance zone in the near term.
Technical indicators:
Hourly MACD – The MACD is now gaining momentum in the bearish zone.
Hourly RSI (Relative Strength Index) – The RSI for BTC/USD is currently well below the 50 level and approaching 20.
Major Support Levels – $18,000, followed by $17,620.
Major Resistance Levels – $18,500, $18,700 and $19,000.