
Reason to trust
How Our News is Made
Strict editorial policy that focuses on accuracy, relevance, and impartiality
Ad discliamer
Morbi pretium leo et nisl aliquam mollis. Quisque arcu lorem, ultricies quis pellentesque nec, ullamcorper eu odio.
Bitcoin price is attempting an upside correction above the $22,000 resistance. BTC must clear $22,350 and $22,400 to continue higher in the near term.
- Bitcoin is slowly moving higher above the $21,800 and $22,000 levels.
- The price is trading above $21,800 and the 100 hourly simple moving average.
- There is a key bullish trend line forming with support near $22,000 on the hourly chart of the BTC/USD pair (data feed from Kraken).
- The pair could continue higher if there is a clear move above $22,350 and $22,400.
Bitcoin Price Recovers Post US CPI
Bitcoin price remained stable above the $21,500 support zone. Yesterday, the US CPI report was released, which came in at 6.4% (YoY), down from 6.5%. There were swing moves in BTC, but the price finally managed to start a recovery wave.
The price was able to clear the $21,800 and $22,000 resistance levels. The price spiked above the $22,300 level. A high is formed near $22,331 and the price is now correcting lower.
Bitcoin price traded below the 23.6% Fib retracement level of the recent wave from the $21,505 swing low to $22,331 high. It is now trading above $21,800 and the 100 hourly simple moving average. There is also a key bullish trend line forming with support near $22,000 on the hourly chart of the BTC/USD pair.
On the upside, an immediate resistance is near the $22,350 level. The next major resistance is near the $22,400 zone. A clear move above the $22,400 resistance might start a steady increase.
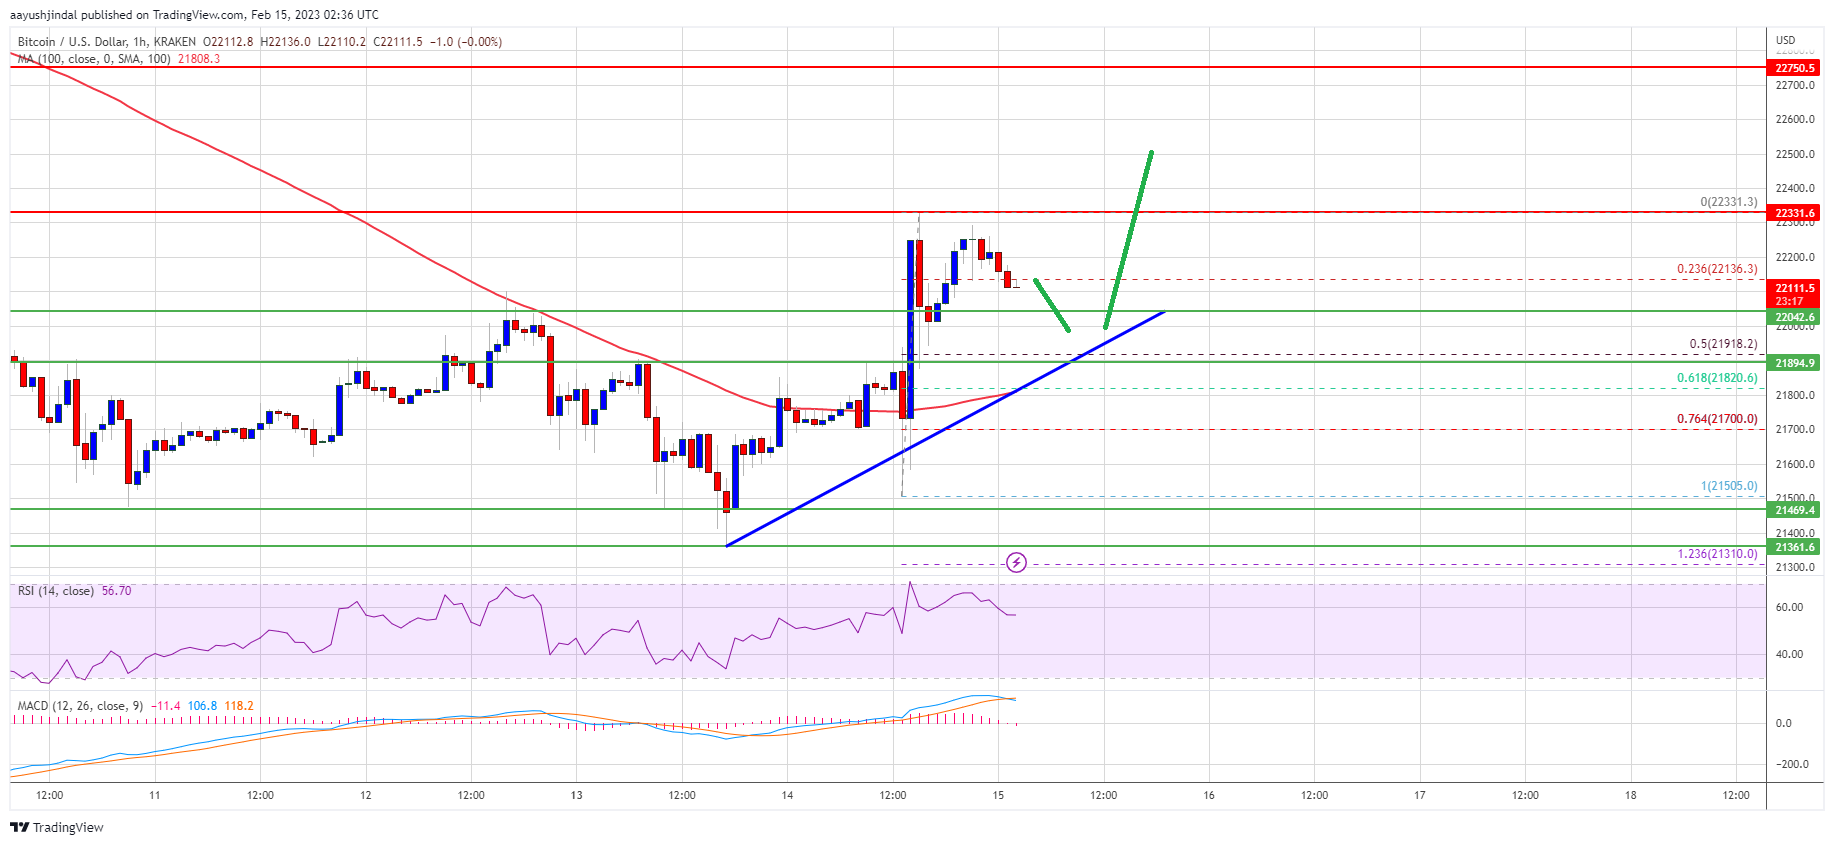
Source: BTCUSD on TradingView.com
In the stated case, the price may perhaps rise towards the $22,800 level. The next resistance could be near the $23,250 level, above which btc price might rise towards the $23,750 resistance zone.
Fresh Decline in BTC?
If bitcoin price fails to clear the $22,400 resistance, it could start another decline. An immediate support on the downside is near the $22,050 zone and the trend line.
The trend line is near the 50% Fib retracement level of the recent wave from the $21,505 swing low to $22,331 high. The next major support is near the $21,800 level, below which the price might decline towards the $21,500 support.
Technical indicators:
Hourly MACD – The MACD is now losing pace in the bullish zone.
Hourly RSI (Relative Strength Index) – The RSI for BTC/USD is now above the 50 level.
Major Support Levels – $22,000, followed by $21,800.
Major Resistance Levels – $22,350, $22,400 and $22,800.