Reason to trust
How Our News is Made
Strict editorial policy that focuses on accuracy, relevance, and impartiality
Ad discliamer
Morbi pretium leo et nisl aliquam mollis. Quisque arcu lorem, ultricies quis pellentesque nec, ullamcorper eu odio.
Bitcoin price started a strong increase and traded above the $75,500 zone. BTC is now consolidating and might aim for more gains if it clears $76,000.
- Bitcoin started a decent upward move above the $75,000 zone.
- The price is trading above $73,500 and the 100 hourly simple moving average.
- There is a bullish trend line forming with support at $72,000 on the hourly chart of the BTC/USD pair (data feed from Kraken).
- The pair might continue to rise if it clears the $75,000 and $76,000 levels.
Bitcoin Price Starts Consolidation
Bitcoin price remained supported and extended its increase above the $73,500 level. BTC climbed above the $74,200 and $74,500 resistance levels.
The bulls were able to pump the price above $75,000. A high was formed at $75,998, and the price recently corrected some gains. There was a move below the 23.6% Fib retracement level of the recent upward move from the $70,292 swing low to the $75,998 high.
Bitcoin is now trading above $73,500 and the 100 hourly simple moving average. Besides, there is a bullish trend line forming with support at $72,000 on the hourly chart of the BTC/USD pair.
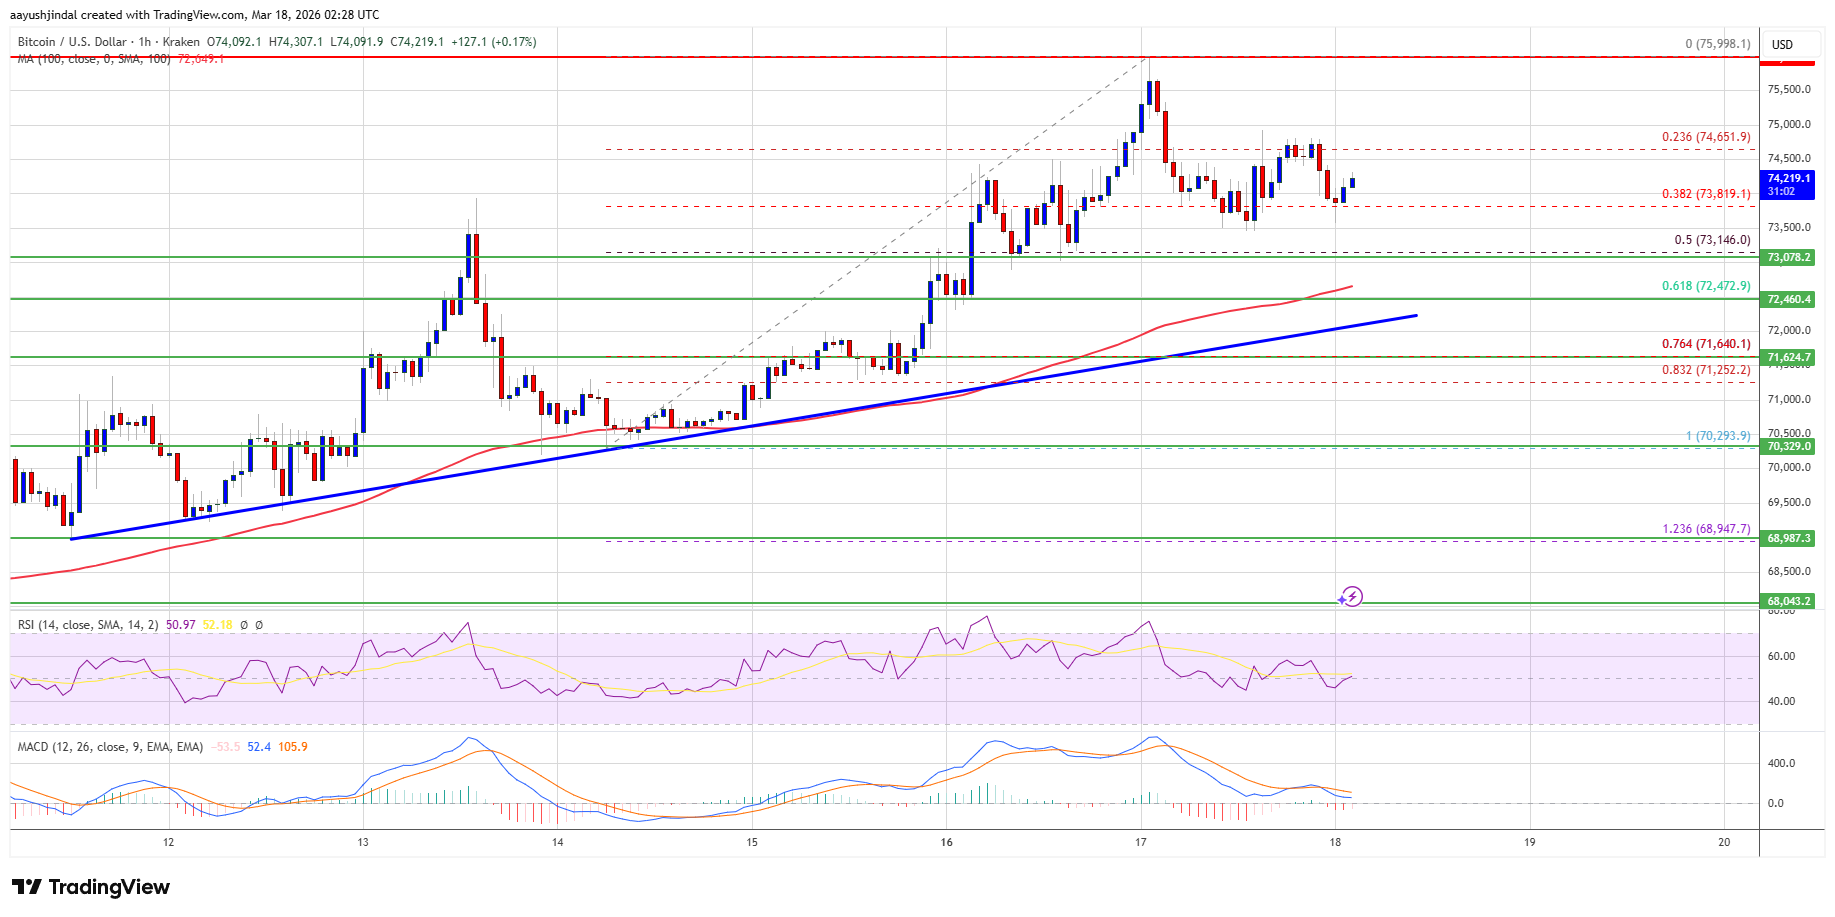
If the price remains stable above $72,000, it could attempt a fresh increase. Immediate resistance is near the $75,000 level. The first key resistance is near the $75,500 level. A close above the $75,500 resistance might send the price further higher. In the stated case, the price could rise and test the $76,200 resistance. Any more gains might send the price toward the $77,500 level. The next barrier for the bulls could be $78,000.
Downside Extension In BTC?
If Bitcoin fails to rise above the $75,000 resistance zone, it could start another decline. Immediate support is near the $73,800 level. The first major support is near the $73,150 level or the 50% Fib retracement level of the recent upward move from the $70,292 swing low to the $75,998 high.
The next support is now near the $72,000 zone and the trend line. Any more losses might send the price toward the $71,650 support in the near term. The main support now sits at $71,200, below which BTC might struggle to recover in the near term.
Technical indicators:
Hourly MACD – The MACD is now losing pace in the bullish zone.
Hourly RSI (Relative Strength Index) – The RSI for BTC/USD is now above the 50 level.
Major Support Levels – $73,800, followed by $73,150.
Major Resistance Levels – $75,000 and $76,200.