
Reason to trust
How Our News is Made
Strict editorial policy that focuses on accuracy, relevance, and impartiality
Ad discliamer
Morbi pretium leo et nisl aliquam mollis. Quisque arcu lorem, ultricies quis pellentesque nec, ullamcorper eu odio.
Bitcoin price is correcting gains from well above $35,000 against the US Dollar. BTC is approaching a major suppot near $32,350, where the bulls might take a stand.
- Bitcoin started a downside correction from the $36,650 zone.
- The price is now trading below $34,500 and the 100 hourly simple moving average.
- There is a key bearish trend line forming with resistance near $33,800 on the hourly chart of the BTC/USD pair (data feed from Kraken).
- The pair is likely to start a fresh increase as long as there is no close below $32,000.
Bitcoin Price is Approaching Support
Bitcoin failed to stay above the $35,000 support zone and it started a fresh decline. BTC broke the $34,000 support zone to move into a short-term bearish zone.
There was also a break below the 50% Fib retracement level of the upward move from the $30,185 swing low to $36,698 high. It is now trading below $34,500 and the 100 hourly simple moving average. There is also a key bearish trend line forming with resistance near $33,800 on the hourly chart of the BTC/USD pair.
An immediate support on the downside is near the $32,650 level. It is near the 61.8% Fib retracement level of the upward move from the $30,185 swing low to $36,698 high.
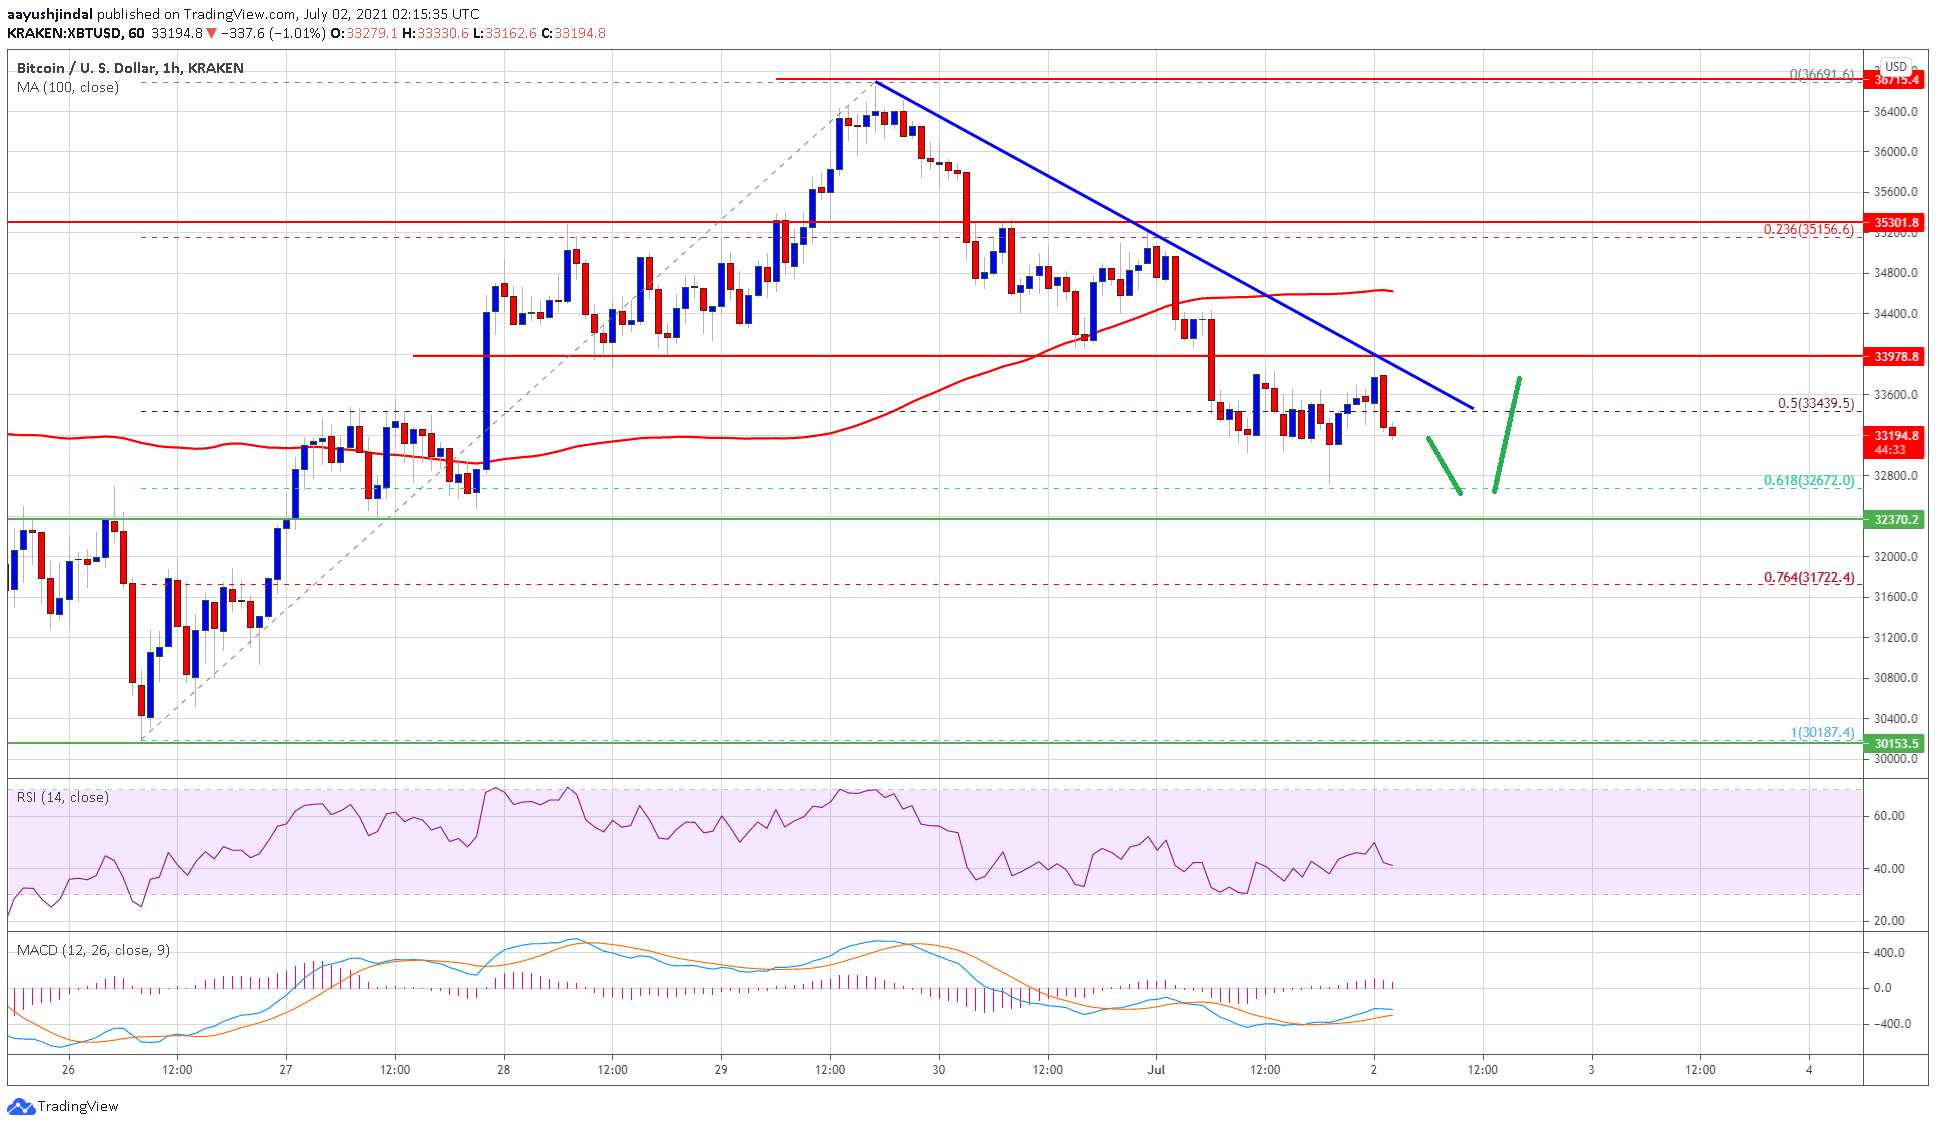
Source: BTCUSD on TradingView.com
The next key support is near the $32,000 zone. If there is a downside break below the $32,350 and $32,000 support levels, the price could continue to move down. In the stated case, the price might decline towards the $30,200 zone. Any more losses may possibly push the price towards the $29,000 support zone.
Fresh Increase in BTC?
If bitcoin remains stable above the $32,000 support zone, it could start a fresh increase in the near term. An immediate resistance on the upside is near the $33,800 level and the trend line.
The next key resistance is near $34,000, above which the price could test the 100 hourly SMA at $34,500. Any more gains could lift the price towards the $35,000 resistance. In this case, the bulls could even aim a fresh test of $36,500.
Technical indicators:
Hourly MACD – The MACD is slowly gaining pace in the bearish zone.
Hourly RSI (Relative Strength Index) – The RSI for BTC/USD is now below the 50 level.
Major Support Levels – $32,350, followed by $32,000.
Major Resistance Levels – $33,800, $34,000 and $34,500.


