

Bitcoin price extended its upward move above the $59,000 zone against the US Dollar. BTC is showing positive signs and it is likely to accelerate further higher in the near term.
- Bitcoin is rising steadily and it is likely to break the $60,000 resistance zone.
- The price is now well above the $57,000 support and the 100 hourly simple moving average.
- There was a break above a couple of bullish patterns near $57,600 and $58,600 on the hourly chart of the BTC/USD pair (data feed from Kraken).
- The pair could dip in the short-term, but the bulls are likely to remain active above $57,500.
Bitcoin Price Signaling Upside Acceleration
After settling above the $57,000 resistance zone, bitcoin extended its rise. BTC broke the $58,000 and $58,500 resistance levels to move further into a bullish zone.
During the increase, there was a break above a couple of bullish patterns near $57,600 and $58,600 on the hourly chart of the BTC/USD pair. The pair even broke the $59,000 resistance and it settled nicely above the 100 hourly simple moving average.
A high is formed near $59,399 and the price is currently consolidating gains. It corrected below the 23.6% Fib retracement level of the upward move from the $57,079 swing low to $59,399 high.
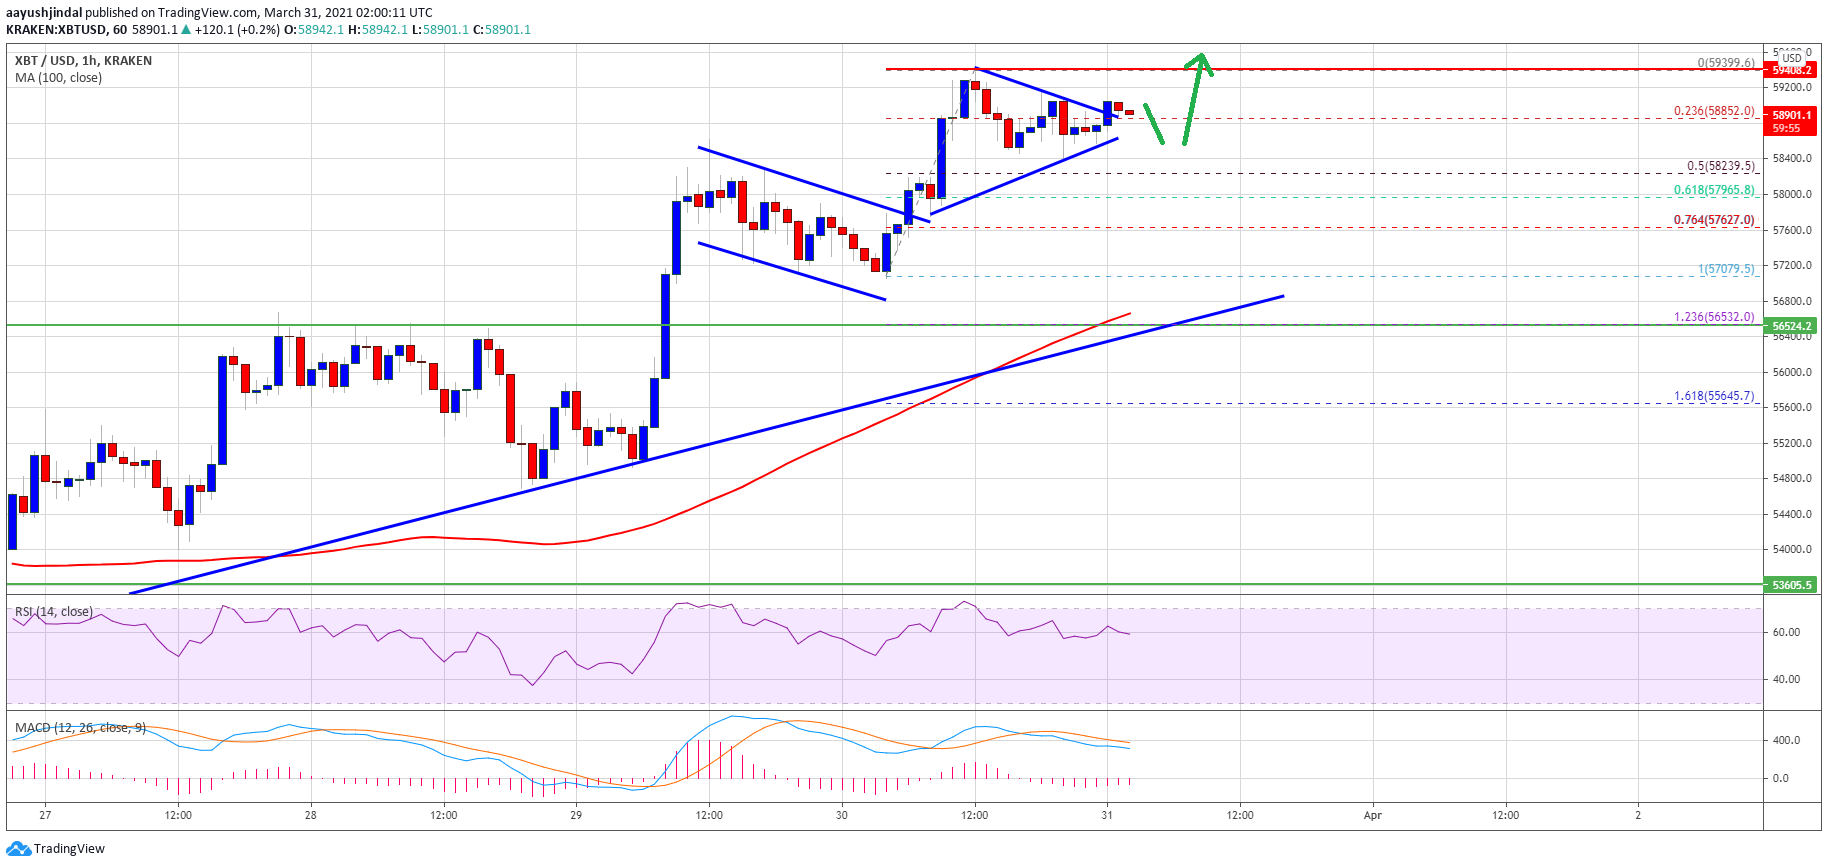
Source: BTCUSD on TradingView.com
On the downside, the $58,500 level is likely to act as a decent support. The 50% Fib retracement level of the upward move from the $57,079 swing low to $59,399 high is also near $58,250. On the upside, the $59,250 zone is a short-term hurdle.
The first major resistance is near the $59,500 level. A clear break above the $59,500 level could increase the chances of an acceleration above the $60,000 zone in the coming sessions.
Dips Supported in BTC?
If bitcoin fails to climb above $59,250 and $59,500, there could be a downside correction. As stated, the $58,500 level is a decent support zone.
The next major support is near the $58,000 level. Any more losses might call for a drop towards the $57,000 support zone and a major bullish trend line on the same chart in the near term.
Technical indicators:
Hourly MACD – The MACD is now gaining momentum in the bullish zone.
Hourly RSI (Relative Strength Index) – The RSI for BTC/USD is nicely above the 50 level.
Major Support Levels – $58,500, followed by $58,000.
Major Resistance Levels – $59,250, $59,500 and $60,000.