
Reason to trust
How Our News is Made
Strict editorial policy that focuses on accuracy, relevance, and impartiality
Ad discliamer
Morbi pretium leo et nisl aliquam mollis. Quisque arcu lorem, ultricies quis pellentesque nec, ullamcorper eu odio.
Bitcoin price is consolidating losses above the $19,200 support zone against the US Dollar. BTC could start a fresh increase if there is a clear move above $19,700.
- Bitcoin is facing barrier near the $19,550 and $19,600 resistance levels.
- The price is below above $20,100 and the 100 hourly simple moving average.
- There was a break above a key bearish trend line with resistance near $19,450 on the hourly chart of the BTC/USD pair (data feed from Kraken).
- The pair could gain bullish momentum if there is a clear move above the $19,700 resistance.
Bitcoin Price Holds Key Support
Bitcoin price started a fresh decline from well above the $20,200 level. BTC declined below the $20,000 and $19,800 levels to move into a bearish zone.
The bears even pushed the price below the $19,500 level and the 100 hourly simple moving average. It traded as low as $19,249 and recently started a short-term upside correction. There was a minor increase above the $19,400 and $19,500 levels.
There was a break above a key bearish trend line with resistance near $19,450 on the hourly chart of the BTC/USD pair. Bitcoin price tested the 23.6% Fib retracement level of the downward move from the $20,443 swing high to $19,249 low.
On the upside, an immediate resistance is near the $19,550 level. The next major resistance sits near the $19,700 zone and the 100 hourly simple moving average.
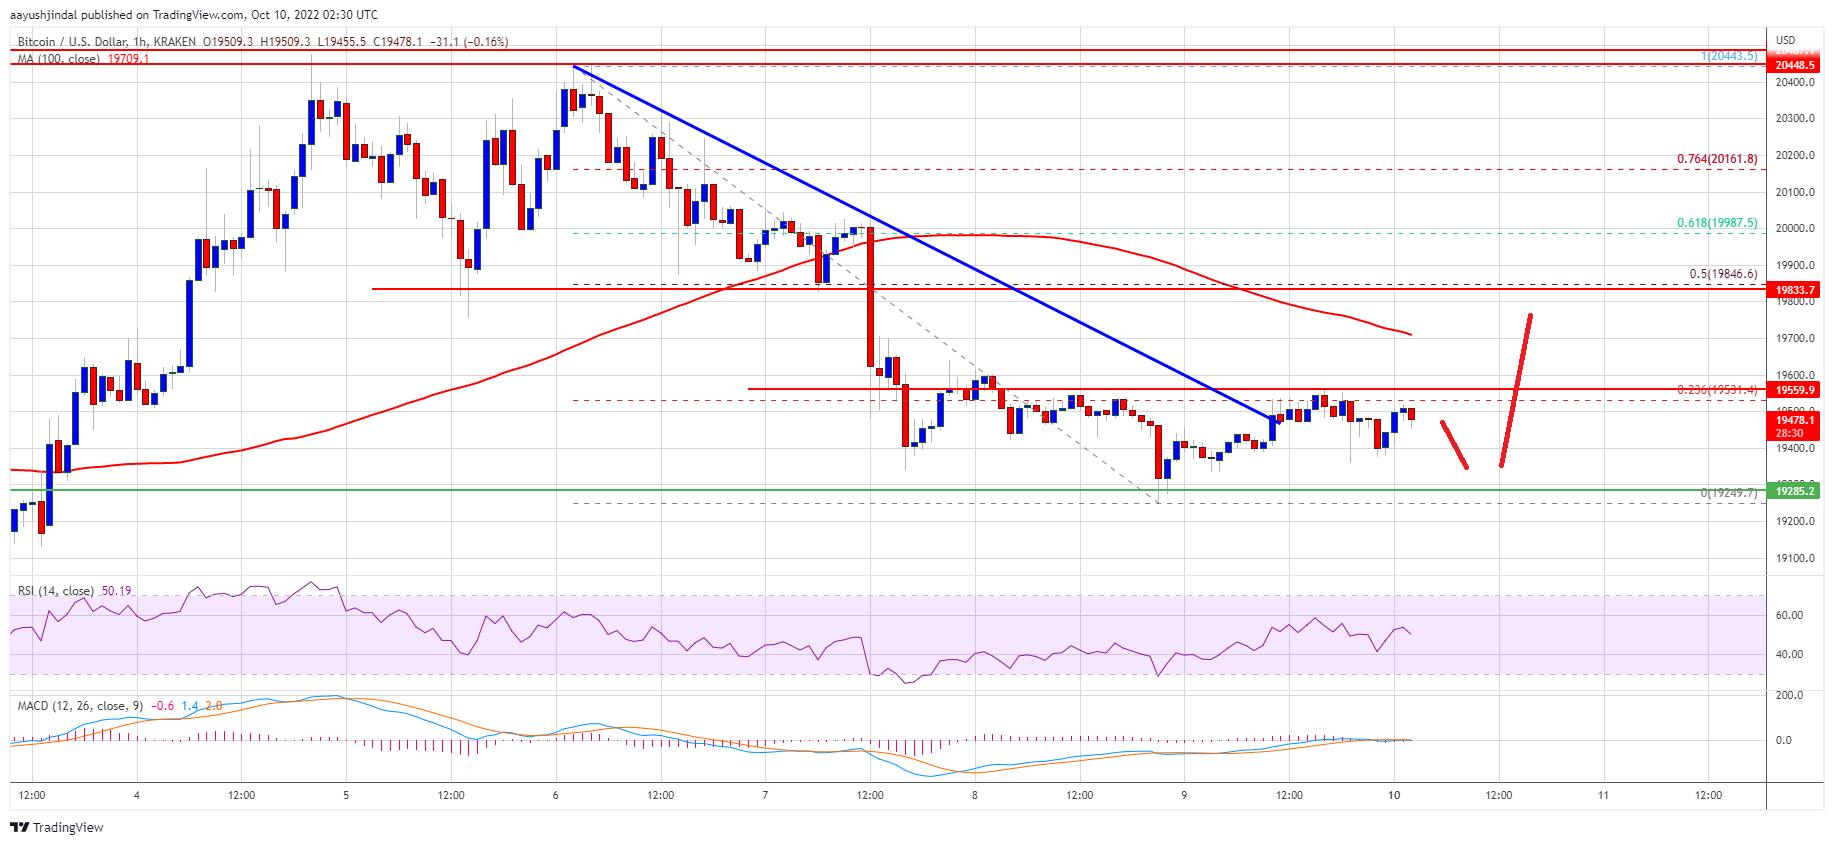
Source: BTCUSD on TradingView.com
A proper close above the $19,700 resistance might send the price towards the 50% Fib retracement level of the downward move from the $20,443 swing high to $19,249 low. Any more gains might send the price above the $20,000 resistance. In the stated case, the price could rise towards the $20,500 resistance level.
Dips Limited in BTC?
If bitcoin fails to rise above the $19,700 resistance zone, it could continue to move down. An immediate support on the downside is near the $19,400 zone.
The next major support is near the $19,250 zone. A downside break below the $19,250 support zone might call for more losses. In the stated case, there is a risk of a move towards the $18,500 support zone.
Technical indicators:
Hourly MACD – The MACD is now losing pace in the bearish zone.
Hourly RSI (Relative Strength Index) – The RSI for BTC/USD is now above the 50 level.
Major Support Levels – $19,400, followed by $19,250.
Major Resistance Levels – $19,700, $20,000 and $20,500.


