Reason to trust
How Our News is Made
Strict editorial policy that focuses on accuracy, relevance, and impartiality
Ad discliamer
Morbi pretium leo et nisl aliquam mollis. Quisque arcu lorem, ultricies quis pellentesque nec, ullamcorper eu odio.
Bitcoin price failed to stay above the $35,000 support against the US Dollar. BTC is declining and it is likely to extend losses below $33,000 in the short-term.
- Bitcoin started a fresh decline after it broke the $36,500 and $36,000 support levels.
- The price is currently well below $36,000 and the 100 hourly simple moving average.
- There was a break below a major ascending channel with support near $35,600 on the hourly chart of the BTC/USD pair (data feed from Kraken).
- The pair is likely to continue lower below the $33,000 and $32,000 support levels.
Bitcoin Price is Down Over 5%
Bitcoin failed to stay above the $36,500 support zone and extended its decline. BTC broke the $35,500 support level and settled below the 100 hourly simple moving average.
There was a clear break below a major ascending channel with support near $35,600 on the hourly chart of the BTC/USD pair. The pair gained pace below the $35,00 support level and it even broke $34,200. There was a spike below the $34,000 level and the price is currently struggling to recover.
An immediate resistance is near the $34,150 level. It is near the 23.6% Fib retracement level of the recent drop from the $36,824 high to $33.350 low.
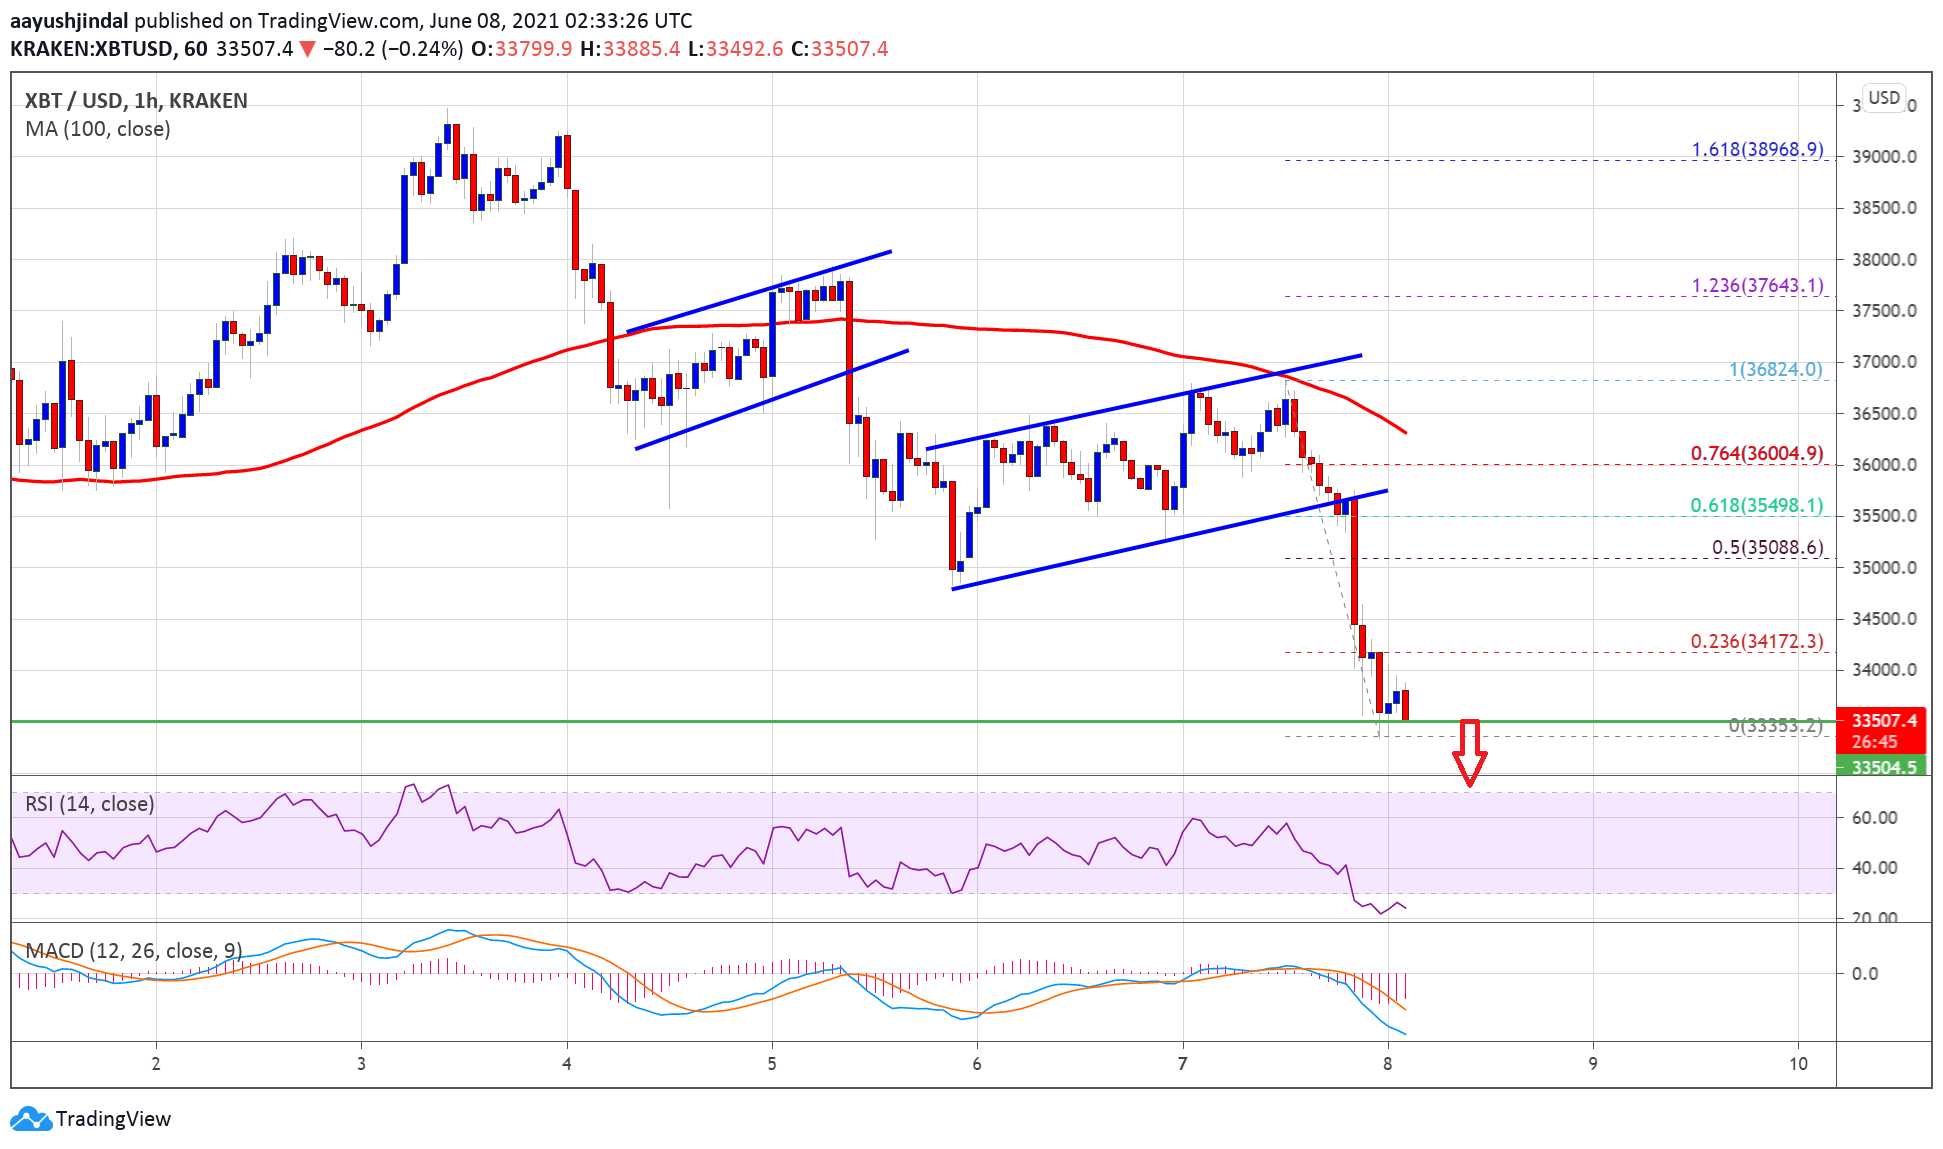
Source: BTCUSD on TradingView.com
The first major resistance is near the $35,000 level. The 50% Fib retracement level of the recent drop from the $36,824 high to $33.350 low is also near $35,100. The main resistance is near the $36,000 zone and the 100 hourly simple moving average. A clear break above the $36,000 level could reverse the current bearish bias.
More Losses in BTC?
If bitcoin fails to clear the $35,000 resistance, it could continue to move down. An initial support on the downside is near the $33,200 level.
The first major support is near the $32,500 level. The main support is near the $32,000 level. If the bulls fail to protect the $32,000 support zone, there is a risk of a sharp decline. In the stated case, the price could even struggle to stay above the key $30,000 support zone.
Technical indicators:
Hourly MACD – The MACD is now gaining pace in the bearish zone.
Hourly RSI (Relative Strength Index) – The RSI for BTC/USD is now well below the 50 level.
Major Support Levels – $33,200, followed by $32,000.
Major Resistance Levels – $34,150, $35,000 and $36,000.