
Reason to trust
How Our News is Made
Strict editorial policy that focuses on accuracy, relevance, and impartiality
Ad discliamer
Morbi pretium leo et nisl aliquam mollis. Quisque arcu lorem, ultricies quis pellentesque nec, ullamcorper eu odio.
Bitcoin extended increase above the $44,000 resistance zone against the US Dollar. BTC is correcting gains and might decline further if it breaks the $42,800 support.
- Bitcoin extended gains and even climbed above the $45,000 resistance zone.
- The price is trading above $42,500 and the 100 hourly simple moving average.
- There was a break below a key bullish trend line with support near $44,000 on the hourly chart of the BTC/USD pair (data feed from Kraken).
- The pair could extend decline if there is a clear move below the $42,800 support zone.
Bitcoin Price Corrects Lower
Bitcoin price remained in a positive zone above the $42,000 level. BTC gained pace for a move above the $44,000 and $44,500 levels. It even surpassed the $45,000 level and settled above the 100 hourly simple moving average.
It traded as high as $45,500 and recently started a downside correction. There was a move below the $44,000 support level. Besides, there was a break below a key bullish trend line with support near $44,000 on the hourly chart of the BTC/USD pair.
The pair even declined below the 50% Fib retracement level of the upward move from the $41,140 swing low to $45,500 high. However, the bulls defended the $42,800 support zone.
The 61.8% Fib retracement level of the upward move from the $41,140 swing low to $45,500 high also acted as a strong support. Bitcoin price is now trading above $42,500 and the 100 hourly simple moving average. On the upside, an immediate resistance is near the $44,000 level.
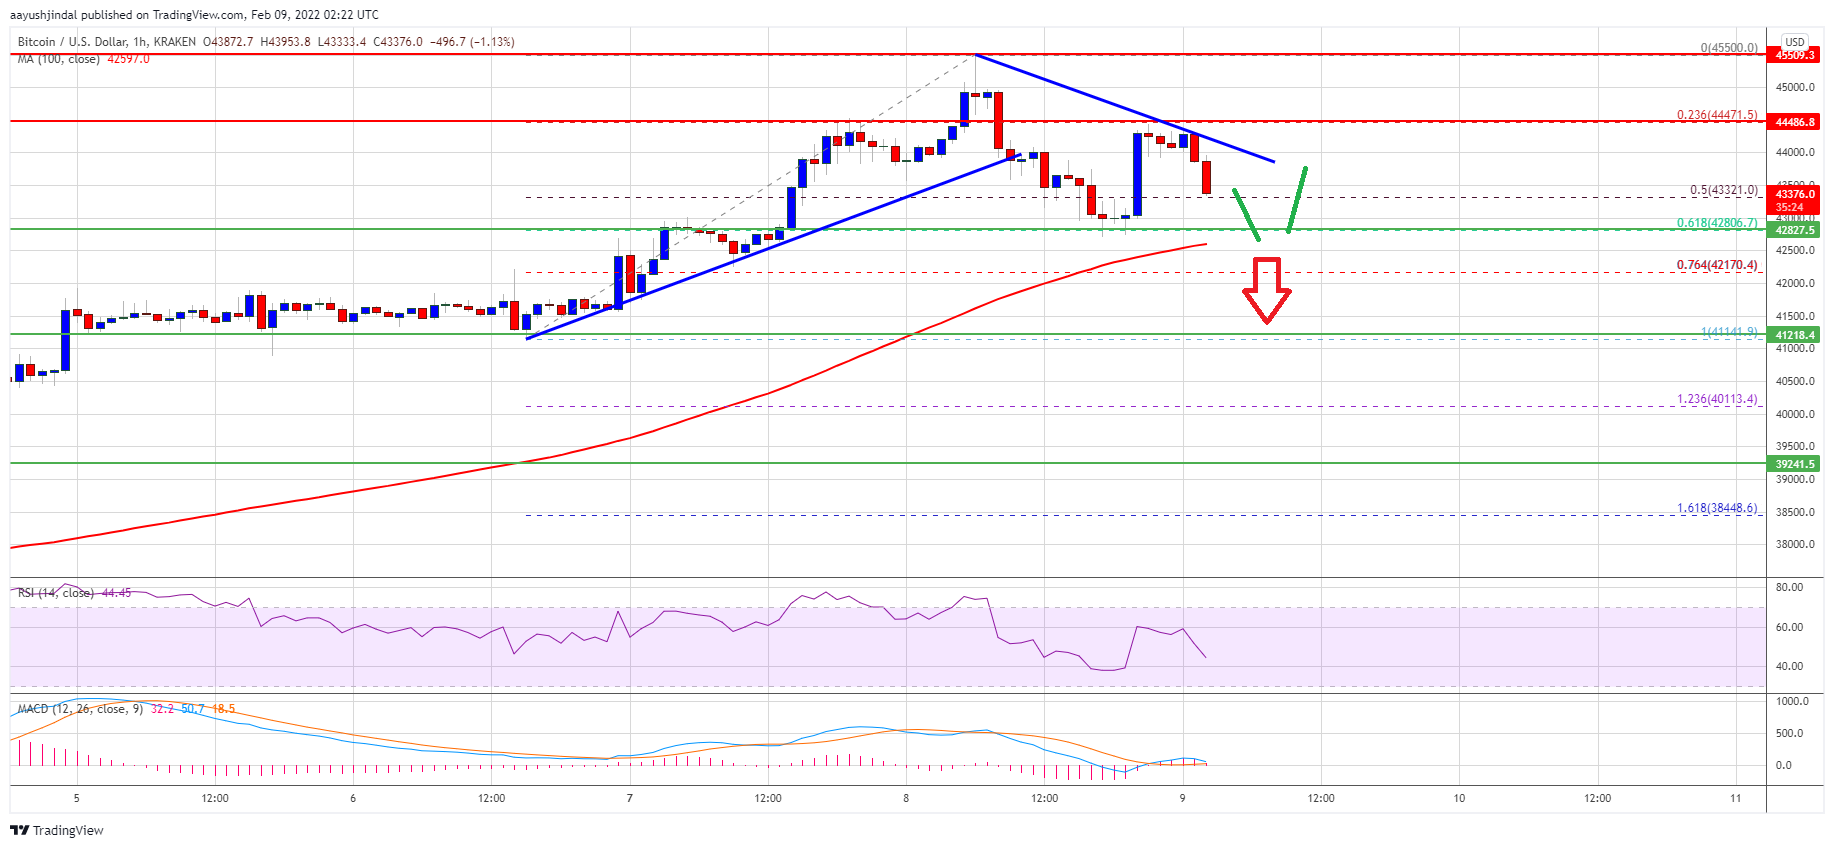
Source: BTCUSD on TradingView.com
There is also a connecting bearish trend line with resistance near $44,000 on the same chart. The next major resistance is near the $44,450 zone, above which the price may perhaps start a fresh increase in the near term.
Downside Break in BTC?
If bitcoin fails to start a fresh increase above $44,000, it could continue to move down. An immediate support on the downside is near the $42,800 zone.
The next major support is seen near the $42,500 level and the 100 hourly simple moving average. If there is a downside break below the $42,500 support, the price could slide towards the $41,200 level.
Technical indicators:
Hourly MACD – The MACD is now gaining momentum in the bearish zone.
Hourly RSI (Relative Strength Index) – The RSI for BTC/USD is now below the 50 level.
Major Support Levels – $42,800, followed by $42,500.
Major Resistance Levels – $44,000, $44,450 and $45,500.


