
Reason to trust
How Our News is Made
Strict editorial policy that focuses on accuracy, relevance, and impartiality
Ad discliamer
Morbi pretium leo et nisl aliquam mollis. Quisque arcu lorem, ultricies quis pellentesque nec, ullamcorper eu odio.
Bitcoin price remained in a bullish zone and it made another attempt to gain pace above $19,500 against the US Dollar. BTC is clearing struggling to stay above $19,500, which is a major breakout zone.
- Bitcoin is slowly moving higher towards the $19,500 and $19,550 resistance levels.
- The price is currently well above the $19,200 level and the 100 hourly simple moving average.
- There is a key rising channel forming with support near $19,200 on the hourly chart of the BTC/USD pair (data feed from Kraken).
- The pair could correct lower if it continues to struggle near $19,500 and $19,550.
Bitcoin Price is Facing a Major Hurdle
After forming a support base near $19,200, bitcoin price started a fresh increase. BTC broke the $19,400 resistance and it settled nicely above the 100 hourly simple moving average.
The price even spiked above $19,500 once again, but it failed to hold gains. A high is formed near $19,555 and the price is currently correcting lower. There was a drop below the $19,400 level, and the price traded close to the 50% Fib retracement level of the recent wave from the $19,083 swing low to $19,555 high.
On the downside, there is a decent support forming near the $19,200 level. There is also a key rising channel forming with support near $19,200 on the hourly chart of the BTC/USD pair.
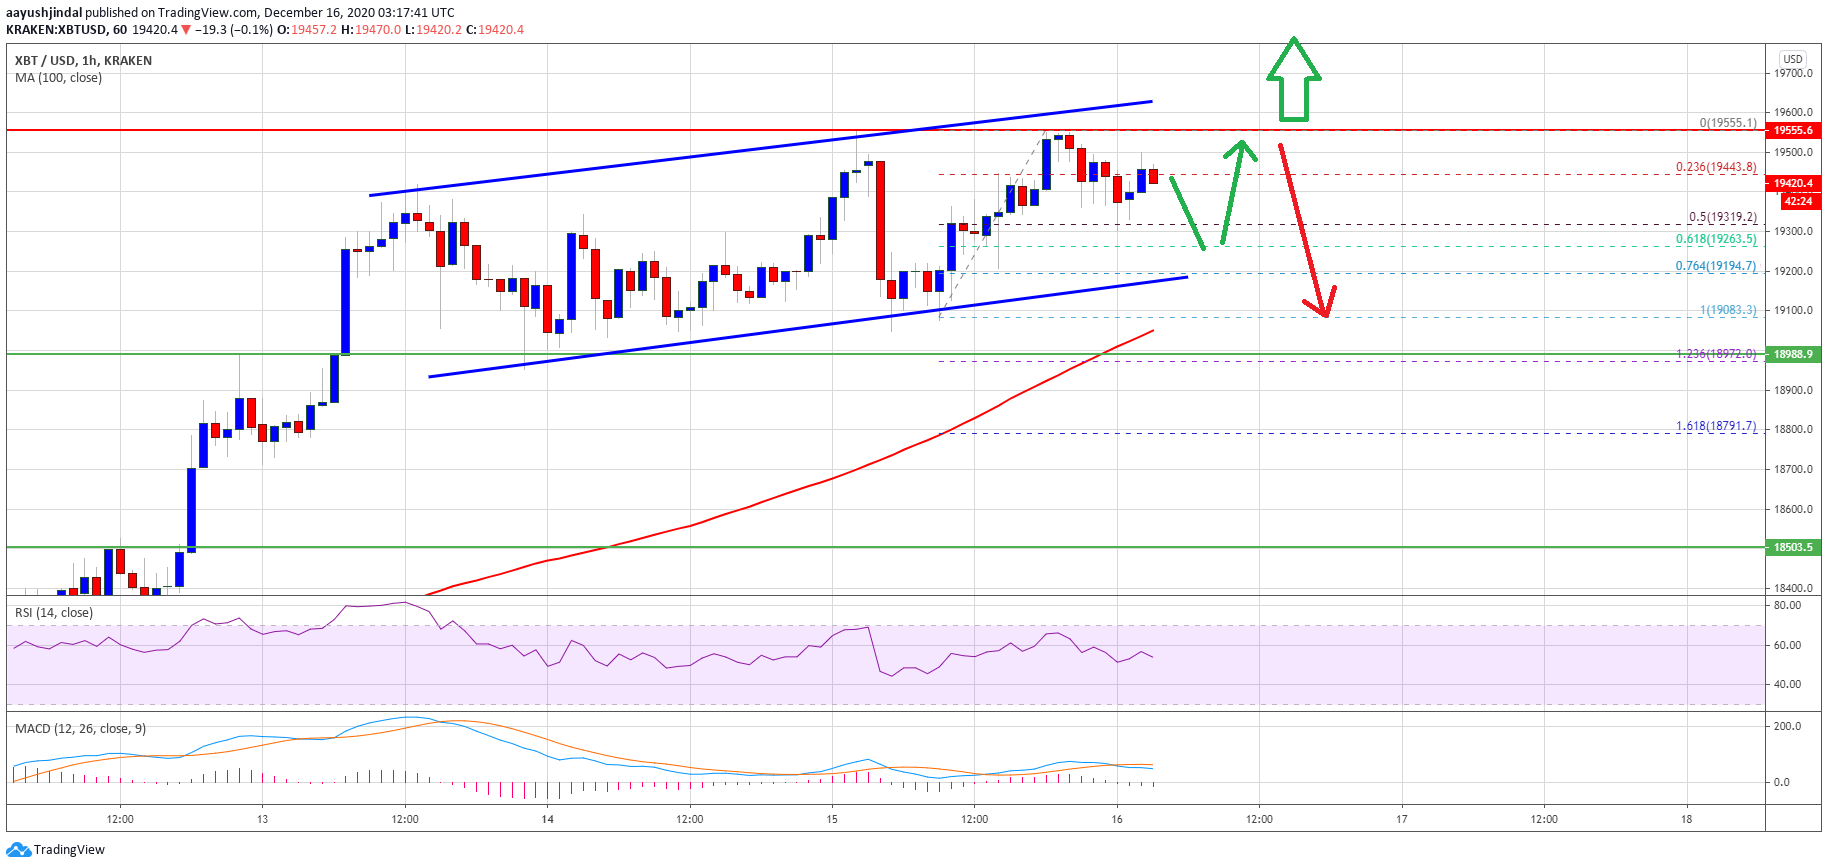
Source: BTCUSD on TradingView.com
The channel support is close to the 76.4% Fib retracement level of the recent wave from the $19,083 swing low to $19,555 high. On the upside, the price is clearly facing a strong resistance near $19,500 and $19,550. Bitcoin price must settle above the $19,500 level and gain pace above $19,550 to rise towards the $19,800 and $20,000 resistance levels.
Downsides Supported in BTC?
If bitcoin starts another downside correction, it could find support near the $19,260 level. The first key support is near the channel lower trend line or $19,200.
A downside break below the channel support might lead the price towards the $19,000 support or the 100 hourly simple moving average. Any more losses may possibly spark a larger decline towards $18,500 in the near term.
Technical indicators:
Hourly MACD – The MACD is struggling to gain momentum in the bullish zone.
Hourly RSI (Relative Strength Index) – The RSI for BTC/USD is currently dipping towards the 50 level.
Major Support Levels – $19,260, followed by $19,200.
Major Resistance Levels – $19,500, $19,550 and $20,000.


