

Bitcoin bulls are hoping the bottom is in and heads off onto another moon mission toward new all-time highs.
But before it gets there, if the bottom is indeed in, the top cryptocurrency by market cap could target the top of the weekly BTCUSD Ichimoku cloud next. Let’s take a look.
Why Bitcoin Could Soon Target $40,000
The Ichimoku Kinko Hyo was developed in the 1930s by Japanese journalist Goichi Hosoda, and is loosely translated to “one glance equilibrium chart.”
The Ichimoku indicator is a unique tool, generating a “graphic environment” with a variety of signals. For example, Bitcoin is trading above the Tenkan-sen and Kijun-sen, which is a bullish signal. However, the two lines remain crossed bearish and the sideways action of the Kijin-sen suggests the market is lacking a clear trend direction.
Bitcoin passing above the two lines in the past has put in a bottom on the one-week timeframe. If the bottom is indeed in, history then suggests that the next stop for BTCUSD would be the top of the Ichimoku cloud located at roughly $40,000 per BTC.
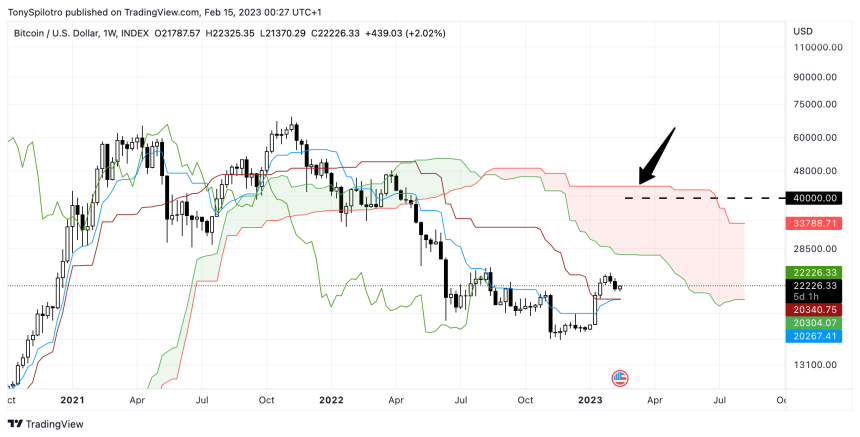

Could Bitcoin target the top of the cloud next? | BTCUSD on TradingView.com
BTCUSD History And The Ichimoku Cloud
Following Bitcoin’s first ever 90% correction, the young cryptocurrency rebounded to the top of the cloud at around $16 in 2012 before climbing to over $1,000 per coin.
In 2015, BTCUSD bottomed at roughly $150, then bounced to the top of the cloud at roughly $400 in 2016 before blasting off to $20,000 in 2017. After the 2018 bottom was in, Bitcoin once again tapped the top of the cloud as its next stop at around $13,000 per BTC.
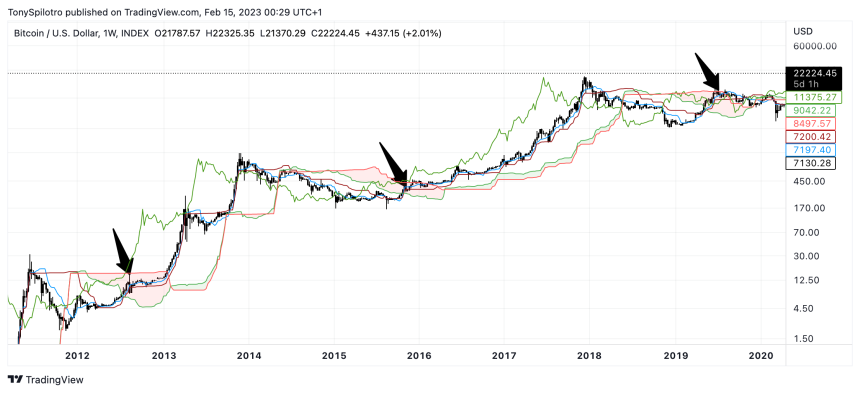

History suggests the cloud it the target | BTCUSD on TradingView.com
Today, Bitcoin is trading at $22,000 and the top of the Ichimoku cloud is at roughly $43,000 per coin. If history repeats – and the cryptocurrency is currently three for three once the bottom was in – then Bitcoin could reach the target in a matter of months.
The cloud, also called the kumo, is made up of Senkou span A and Senkou span B. The edges of the kumo identify possible areas of future support and resistance.
Other signals the kumo can provide include measuring volatility by the narrowing or thickening of clouds, or potential trend changes when the cloud flips from red to green or vice versa.
After a large collapse and FTX-related volatility, the Ichimoku cloud is looking extra thick, but it could ultimately prove to be where Bitcoin targets next.