
Key Highlights
- ADA price is trading above the $0.0840 support and the 100 hourly SMA against the US Dollar (tethered).
- There is a major bullish trend line formed with support at $0.0840 on the hourly chart of the ADA/USD pair (data feed via Bittrex).
- The pair could correct lower in the short term towards $0.0800 before buyers appear.
Cardano price is trading in a bullish zone against the US Dollar and Bitcoin. ADA/USD is likely to trade above $0.0900 after a minor downside correction.
Cardano Price Analysis
After trading as low as $0.0745, cardano price started an upward move against the US Dollar. The ADA/USD pair traded higher slowly and steadily above the $0.0800 and $0.0840 resistance levels. The price traded close to the $0.0900 level and settled above the 100 hourly simple moving average. An intraday high was formed at $0.0887 and later the price started a downside correction.
The price declined below the 23.6% Fibonacci retracement level of the last upward move from the $0.0745 low to $0.0887 high. However, losses were contained by the $0.0840 support and the 100 hourly SMA. More importantly, there is a major bullish trend line formed with support at $0.0840 on the hourly chart of the ADA/USD pair. Below the trend line, the pair could slide towards the $0.0800 level. An intermediate support is $0.0810 and the 50% Fibonacci retracement level of the last upward move from the $0.0745 low to $0.0887 high. On the upside, the price needs to break the $0.0880 and $0.0890 levels to gain traction.
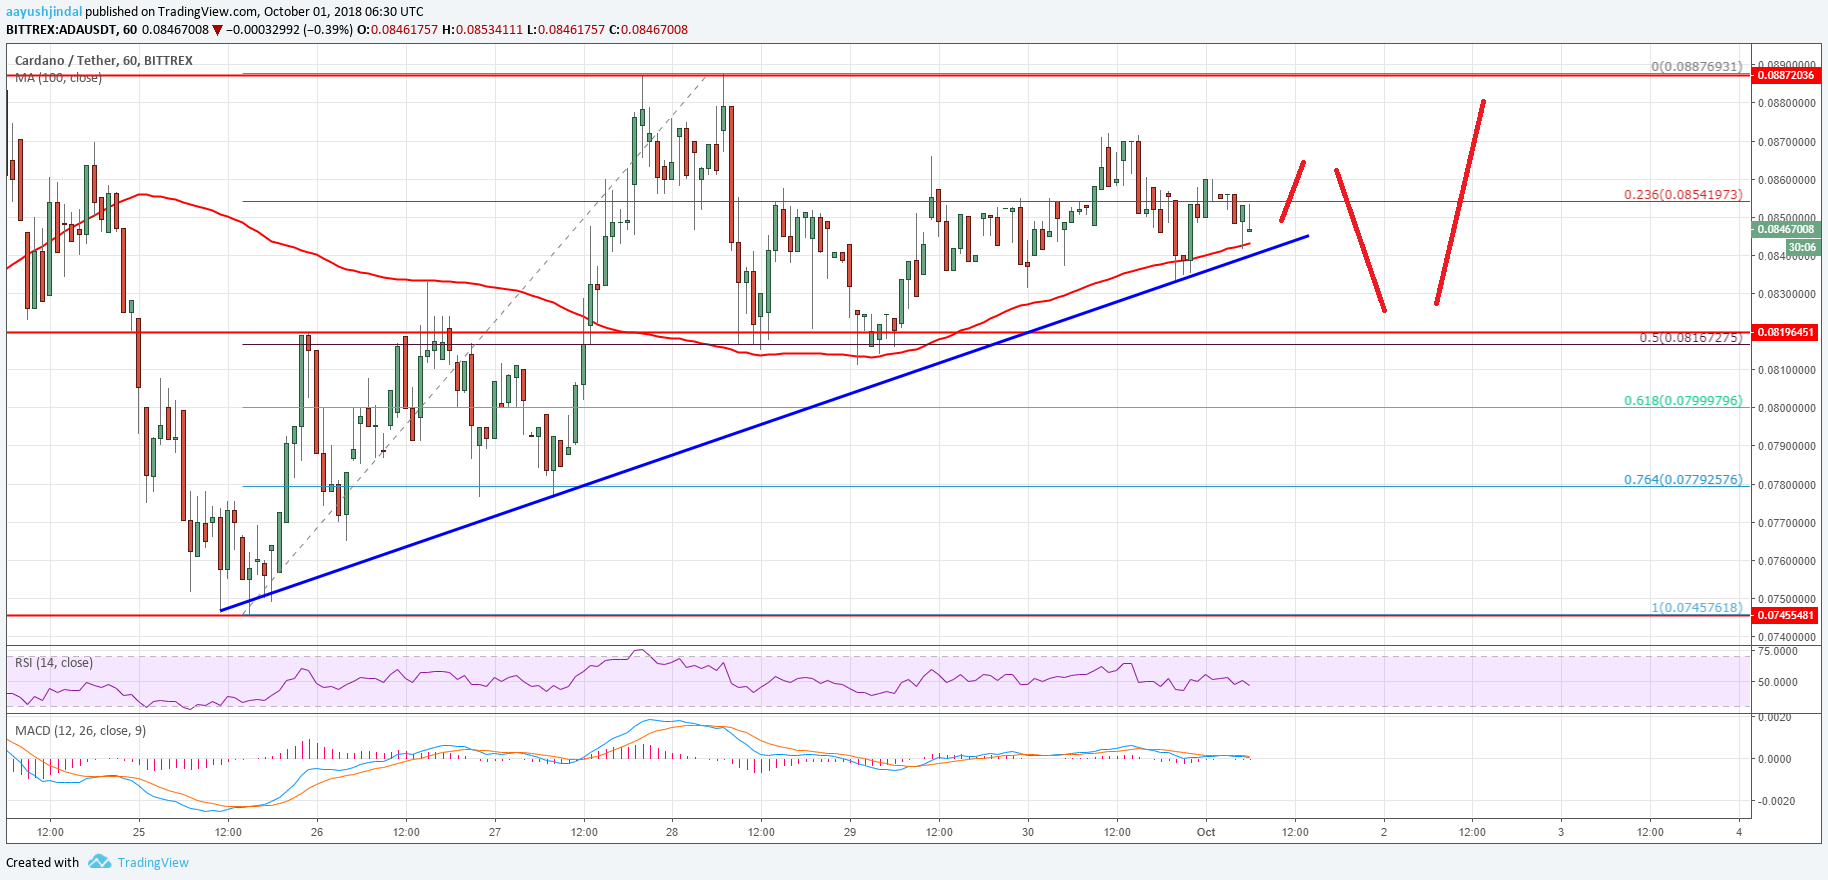

The chart indicates that ADA price may perhaps correct a few points towards $0.0810 or $0.0800. Once the price completes a correction wave, it could climb above $0.0880. It may even clear the $0.0900 resistance and test the $0.1000 level.
Hourly MACD – The MACD for ADA/USD is slowly moving in the bearish zone.
Hourly RSI – The RSI for ADA/USD is just below the 50 level.
Major Support Level – $0.0815
Major Resistance Level – $0.0880