

Key Highlights
- ADA price declined sharply below the $0.0400 support and traded towards $0.0340 against the US Dollar (tethered).
- There is a key bearish trend line formed with resistance at $0.0400 on the hourly chart of the ADA/USD pair (data feed via Bittrex).
- The pair is likely test the $0.0420 resistance level, which is a crucial barrier for buyers.
Cardano price extended losses before buyers appeared against the US Dollar and Bitcoin. ADA/USD must break $0.0420 to gain upside momentum in the near term.
Cardano Price Analysis
There were further losses below the $0.0450 support in cardano price against the US Dollar. The ADA/USD pair declined heavily below the $0.0400 support and settled below the 100 hourly simple moving average. The price even broke the $0.0360 support and traded close to the $0.0330 level. A new monthly low was formed at $0.0331 and later the price started an upside correction.
It climbed above the $0.0360 resistance and traded with a positive tone. Buyers pushed the price above the $0.0380 resistance. Moreover, there was a break above the 50% Fibonacci retracement level of the recent decline from the $0.0452 high to $0.0331 low. However, the price is now approaching the $0.0400 and $0.0420 resistance levels. There is also a key bearish trend line formed with resistance at $0.0400 on the hourly chart of the ADA/USD pair. A proper break above the $0.0400 and $0.0420 resistances is needed for buyers to gain traction. If they fail to clear the $0.0420 resistance, there could be a fresh decline towards the $0.0360 support.
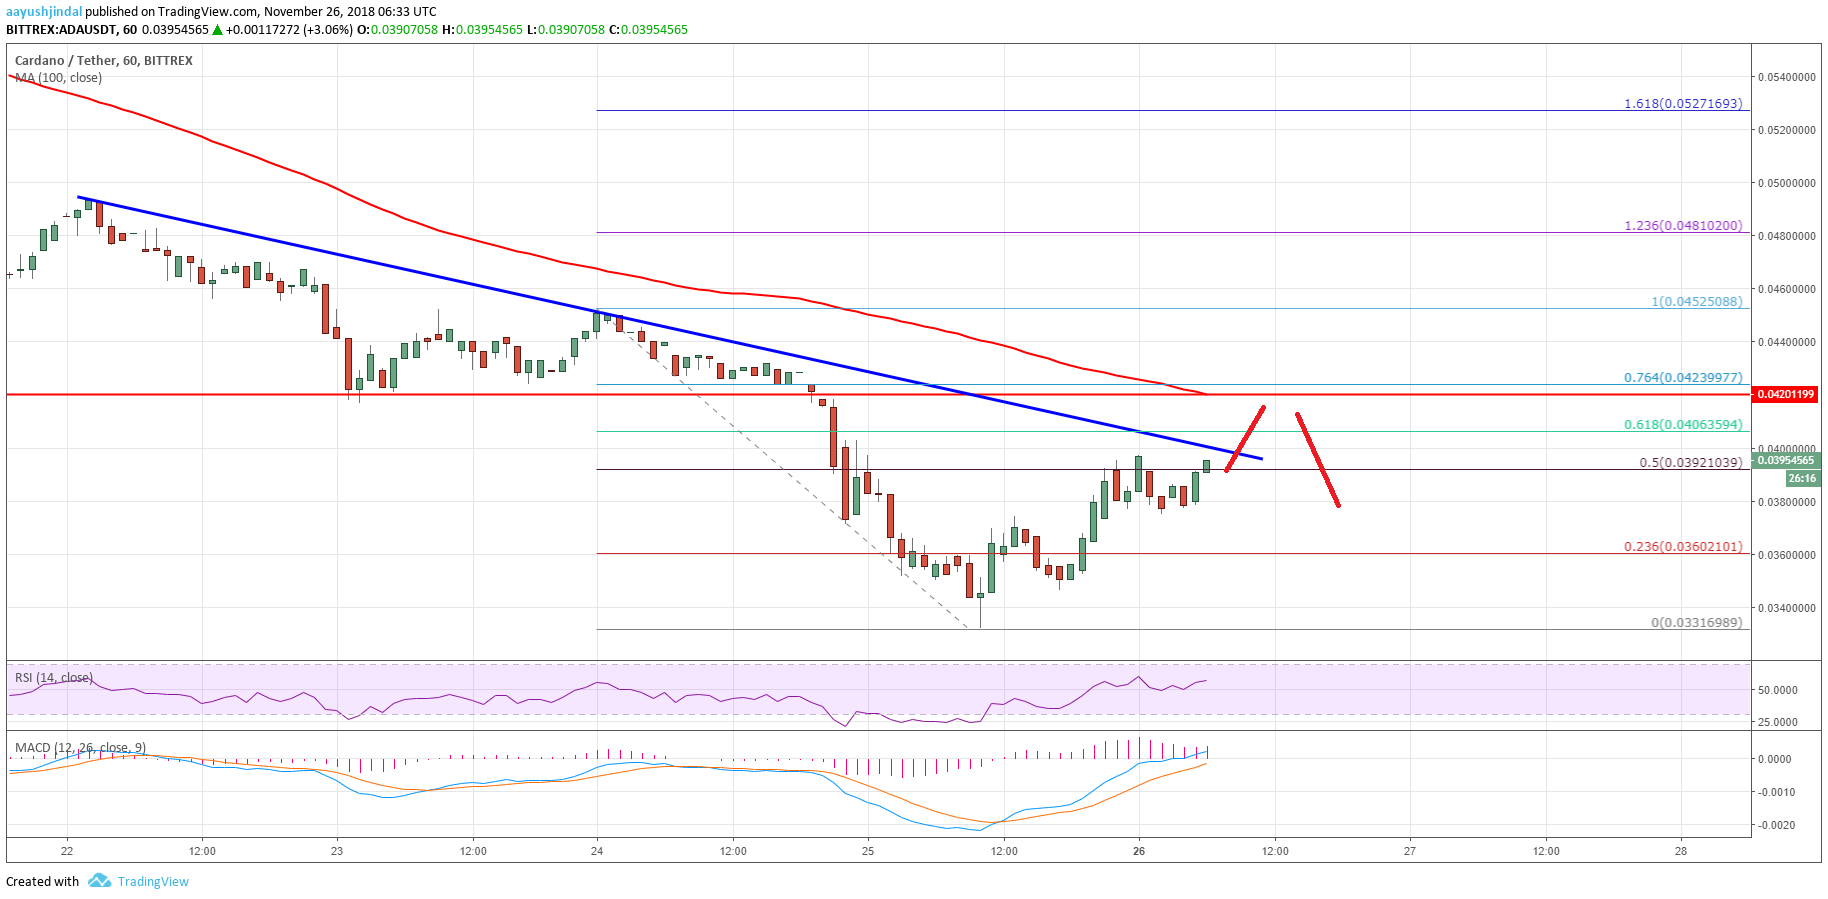

The chart indicates that ADA price bounced back sharply from the $0.0331 low. There are high chances of more gains once buyers push the price above $0.0420. The next resistance is near the $0.0440 and $0.0450 levels.
Hourly MACD – The MACD for ADA/USD is currently placed in the bullish zone.
Hourly RSI – The RSI for ADA/USD is currently well above the 50 level.
Major Support Level – $0.0360
Major Resistance Level – $0.0420