

Key Highlights
- ADA price is holding the $0.0750 support and the 100 hourly simple moving average against the US Dollar (tethered).
- There is a major bearish trend line in place with resistance at $0.0800 on the hourly chart of the ADA/USD pair (data feed via Bittrex).
- The pair remains supported on dips and it could move higher above $0.0800 in the near term.
Cardano price is placed in a positive zone against the US Dollar and Bitcoin. ADA/USD may perhaps break the $0.0800 resistance to climb further higher.
Cardano Price Analysis
Recently, there was a spike above the $0.0800 resistance in cardano price against the US Dollar. The ADA/USD pair traded as high as $0.0847 and retreated quickly. It seems like it turned out to be a false break above the $0.0800 as the price declined towards $0.0750. A low was formed at $0.0749 before the price started a fresh upward move. The price traded above the $0.0775 resistance and remained above the 100 hourly simple moving average.
It broke the 23.6% Fibonacci retracement level of the recent decline from the $0.0847 high to $0.0749 low. However, the price seems to be struggling near the $0.0800 resistance. There is also a major bearish trend line in place with resistance at $0.0800 on the hourly chart of the ADA/USD pair. The same trend line is positioned around the 50% Fibonacci retracement level of the recent decline from the $0.0847 high to $0.0749 low. Therefore, a break above the $0.0800 resistance will most likely open the doors for more gains towards $0.0850 or $0.0900.
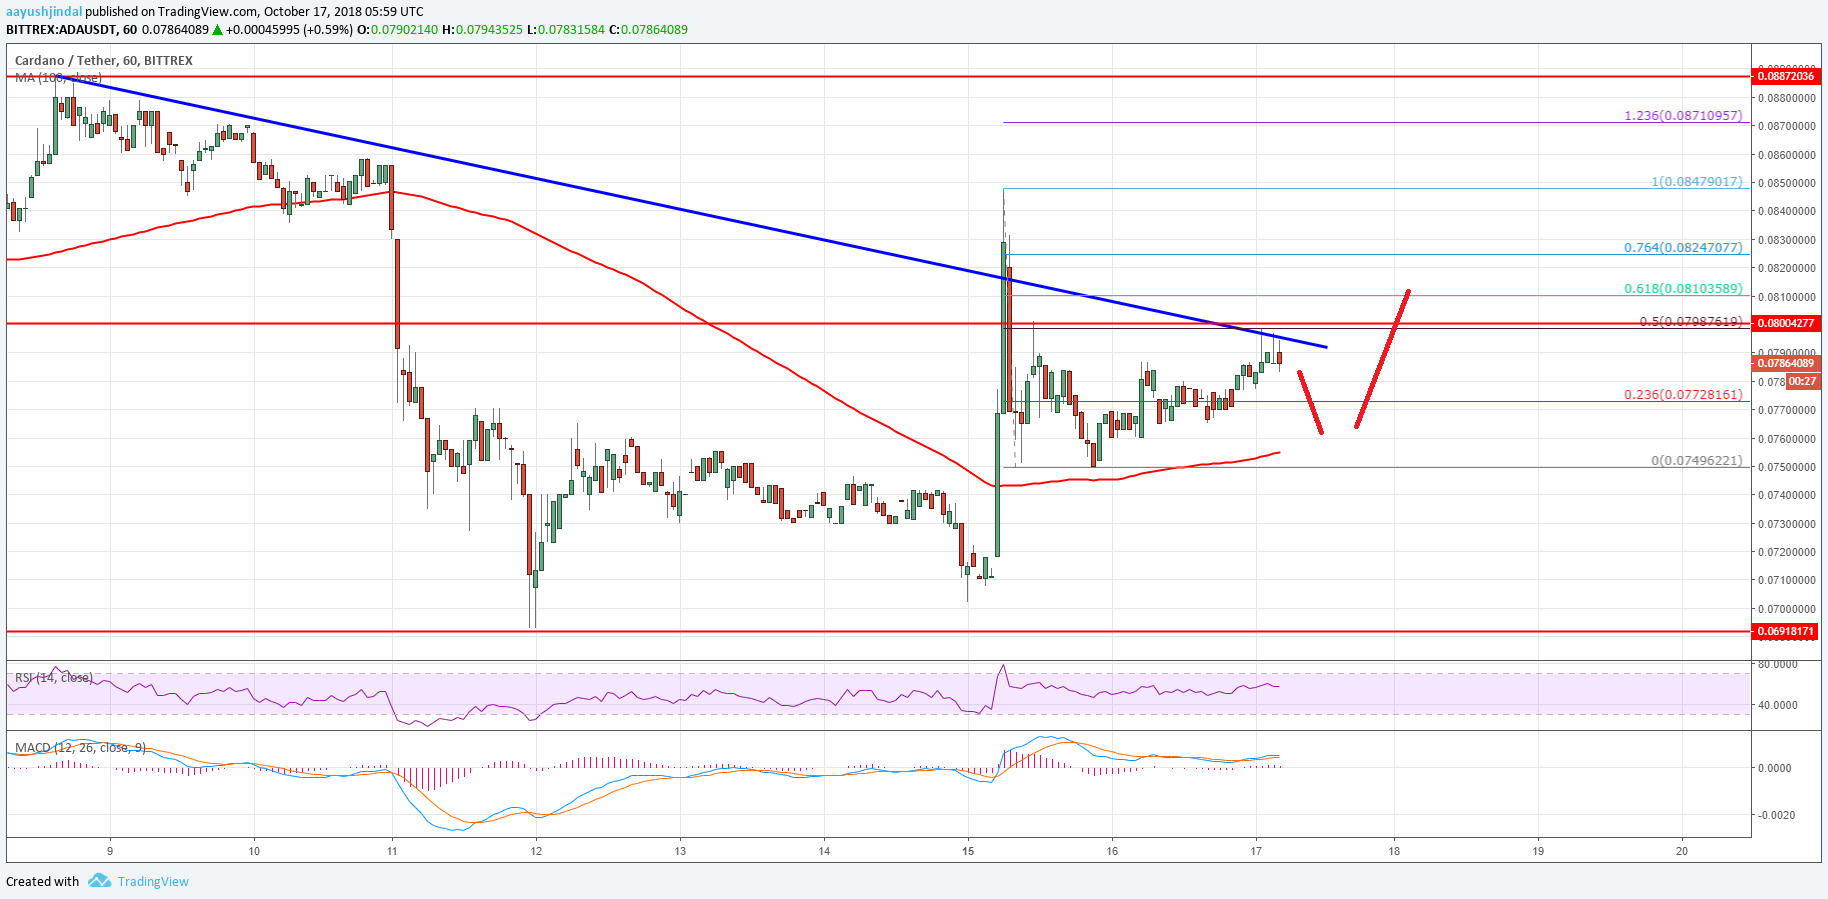

The chart indicates that ADA price is placed nicely above the $0.0750 support and the 100 hourly SMA. As long as the price is above $0.0750, it is likely to clear the $0.0800 resistance in the near term.
Hourly MACD – The MACD for ADA/USD is placed in the bullish zone.
Hourly RSI – The RSI for ADA/USD is currently well above the 50 level.
Major Support Level – $0.0750
Major Resistance Level – $0.0800