

Decentralized oracles firm Chainlink made headlines after the impressive bull rally it has gone through. Its native token, LINK, was able to reach a new all-time high of $14.7 on August 8 as the buying pressure behind it skyrocketed.
The recent price action was able to capture the attention of many market participants, as some believed that the rally was coming to an end. Given the high levels of notoriety that this cryptocurrency has gained over the past few weeks, different fundamental and technical indexes reveal that a correction is imminent.
LINK’s Social Engagement Metrics Explode
Chainlink’s meteoric price action has not gone unnoticed. The number of LINK-related mentions on different social media networks increased as investors appear to have entered a state of FOMO.
The rising chatter around the decentralized oracles token allowed it to move to the top of Santiment’s Emerging Trends list. This is a historically negative sign.
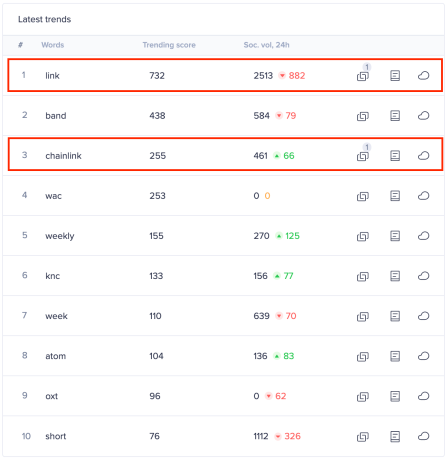

The Chatter Around Chainlink Chainlink Explodes Following New All-Time Highs. (Source: Santiment)
Dino Ibisbegovic, head of content and SEO at Santiment, maintains that when the crowd pays increased attention to a given cryptocurrency because of an ongoing pump, it is usually followed by a steep correction.
“Within the next 12 days after a coin claims a top 3 position on our list of Emerging Trends, its price drops by an average of 8.2 percent. Based on our study, once the increased crowd attention subsides (which usually happens in a matter of hours/days), a short-term price correction – or consolidation – is often a likely outcome,” said Ibisbegovic.


Backtest Results from Emerging Trends. (Source: Santiment)
Indeed, LINK seems to have reached an exhaustion point after investors became overwhelmingly bullish about its price action. Since the peak, this cryptocurrency has pulled back over 15.36%, and it is currently trading around $12.5. Now, a widely know technical index among traders estimates that LINK is poised to retrace further.
Bearish Impulse on the Horizon
The Tom Demark (TD) Sequential index supports the idea that LINK is bound for a steep correction. This technical indicator presented a sell signal in the form of a green nine candlestick on Chainlink’s weekly chart. The bearish formation estimates a one to four weekly candlesticks correction before the uptrend resumes.
Based on historical data, the TD setup has been incredibly accurate at predicting this altcoin’s local tops. When looking at the 1-week chart, it even presented a sell signal in early March, just before prices crashed by 66.75%. Thus, the current pessimistic forecast must be taken seriously despite the hype around its ongoing rally.

TD Index Presents Sell Signal on LINK's 1-Week Chart. (Source: TradingView)
It is worth mentioning that, thus far, each time the TD setup has presented a sell signal on LINK’s weekly chart, the bearish outlook is confirmed by a spike in sell orders. Given the recent price action, it is very likely that the decentralized oracles token sits in overbought territory and that it will indeed correct.
Nonetheless, Chainlink is in price discovery mode, so breaking above the recent high of $14.7 may invalidate all the sell signals. Under this premise, LINK would likely aim for higher highs, and its uptrend will resume.
Featured Image by Depositphotos
Price tags: linkusd, linkbtc
Chart from TradingView.com