

DarkNote Price Key Highlights
- DarkNote price continued to move higher as anticipated in yesterday’s technical analysis post.
- A bullish outside bar candle was formed on the hourly chart, which played well for our target of 0.00000090BTC.
- It’s time to book profits and wait for a correction to look to a possible buy entry.
DarkNote price reached 0.00000090BTC as our highlighted bullish outside bar candle pattern played well.
Buy Dips?
The DarkNote price moved higher and completed our bullish outside bar candle pattern to trade near 0.00000090BTC. The price did not completely test 0.00000090BTC and traded as high as 0.00000089BTC. The price found sellers around the stated level, and it looks set for a correction in the near term. If the price moves lower from the current levels, then an initial support can be seen around the 38.2% Fib retracement level of the last wave from the 0.00000068BTC low to 0.00000089BTC high. However, the most important support can be seen around the 50% Fib level, as it coincides with a broken bearish trend line on the hourly chart.
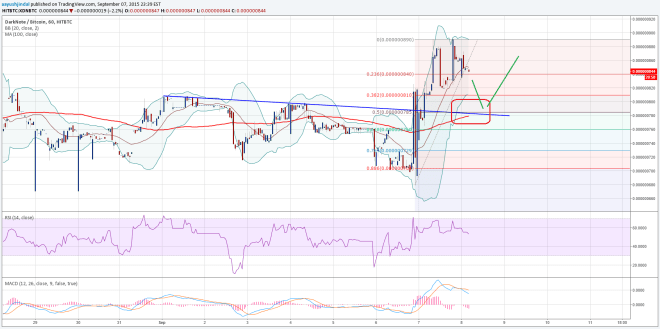

Moreover, the 100 hourly simple moving average is positioned around the highlighted support area. So, there is a chance of buyers appearing around 0.00000078BTC if the price moves lower from the current levels. A break below the 100 hourly SMA might negate the current buy dips view and increase the pressure on buyers.
On the upside, the recent swing high of 0.00000089BTC can be seen as an initial resistance. No doubt, it won’t be easy for buyers to clear 0.00000090BTC but there is a possibility of one more attempt in the near term.
Intraday Support Level – 0.00000078BTC
Intraday Resistance Level – 0.00000089BTC
There is a convergence between the hourly MACD and RSI, pointing towards a minor correction in the DarkNote price.
Charts courtesy of Trading View