Dash Price Key Highlights
- Dash price after trading lower managed to find buyers around 0.0111BTC and currently moving higher.
- There is yet another flag pattern formed on the hourly chart, which might act as a catalyst for the next break in the near term.
- There lies a major resistance around 0.0120BTC, which must be cleared for more gains moving ahead.
Dash price is forming a breakout structure on the hourly chart, which might set the path for the next move.
Flag Pattern
Our previously highlighted flag pattern formed on the hourly chart was successful and opened the doors for more gains. Now, there is another flag pattern forming on the hourly chart after the recent decline in the price. The best part is the fact that the price is above the 100 hourly simple moving average, which is a positive sign. Currently, the price is moving higher and heading towards the 23.6% Fib retracement level of the last drop from 0.0147BTC to 0.0111BTC. It is perfectly moving inside the highlighted flag pattern.
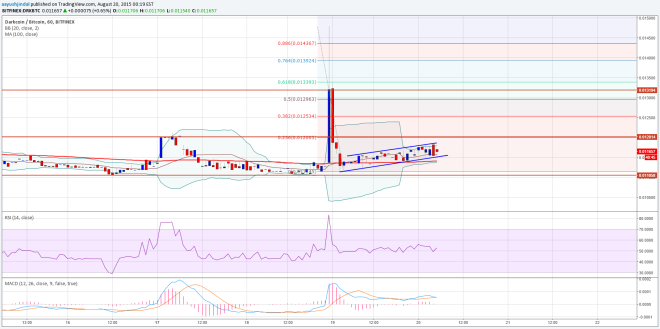

There is a chance that buyers might struggle to clear the 0.0120BTC resistance area, as there is a cluster of hurdles. It also represents the previous swing area, which could act as a major barrier for buyers. If they succeed in breaking it, then a move towards the 38.2% Fib retracement level is possible. Any push further could set the price for a test of the 50% Fib level.
On the downside, the flag pattern support area holds the key, as it is aligned with the 100 hourly SMA. Only a break and close below the 100 SMA might call for a retest of 0.0111BTC.
Intraday Support Level – 0.0114BTC
Intraday Resistance Level – 0.0120TC
The hourly RSI and MACD are pointing more gains in the short term if buyers gain control.
Charts courtesy of Trading View