Dash Price Key Highlights
- Dash price continued to move higher and it looks forming an expanding triangle pattern on the hourly chart.
- We highlighted recently a flag pattern on the hourly chart, but it looks like it is an expanding triangle.
- The price is above the 100 hourly simple moving average, which is a positive sign.
Dash price showing a lot of positive signs, which means there is a chance of the price moving higher in the near term.
Expanding Triangle
We highlighted recently a flag pattern on the hourly chart, but it looks like it is an expanding triangle. The price continued to trade higher, and it looks like it might continue to trade higher. The price is also above the 100 hourly simple moving average, which is yet another positive sign. It looks like there are chances of more gains if buyers stay in control. The Bollinger Bands are moving along the price, which suggests that the momentum is with buyers. If they stay in action for some time, then a break higher is likely.
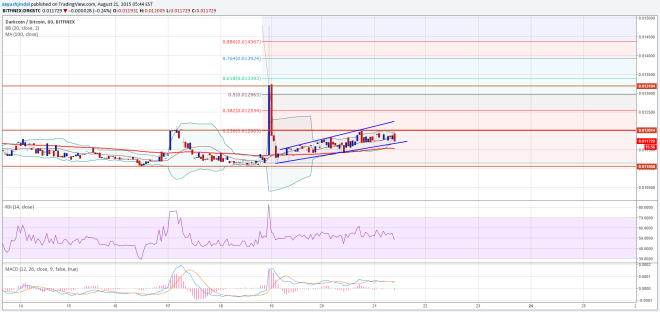

However, there are many hurdles on the way up for the price, including the 23.6% Fib retracement level of the last drop from 0.0147BTC to 0.0111BTC. The mentioned Fib level is around the Upper Bollinger Band, and the triangle resistance area. Moreover, the previous swing area of 0.0120BTC is also aligned around the same fib level. In short, there is a major barrier formed around 0.0120BTC. A break above the same might call for a move towards the 38.2% Fib retracement level. Let’s see how the price reacts around the mentioned area if it reaches there.
On the downside, the expanding triangle support area holds the key.
Intraday Support Level – 0.0114BTC
Intraday Resistance Level – 0.0120TC
The hourly RSI and MACD started to move in the negative zone, which is a bearish sign.
Charts courtesy of Trading View