

Dash Price Key Highlights
- Dash price finally moved lower and retested the last swing low of 0.0110BTC.
- The price is still below the 100 hourly simple moving average, which is concerning and might ignite more losses.
- It would be interesting to see how the price trades in the near term and whether it gain bids around 0.0110BTC or not.
Dash price continued to move lower and finally tested 0.0110BTC as anticipated in one of the previous posts.
Downside Break?
We stated many times that 0.0120BTC is a major resistance, and recently it played well. There was a downside reaction around from the stated level, and the price breached an important support trend line on the hourly chart to trade lower. The price also settled below the 100 hourly simple moving average, which is a bearish sign. The price retested 0.0110BTC, which holds a lot of importance in the near term. The mentioned level is a previous swing area, so we might witness a strong reaction around it.
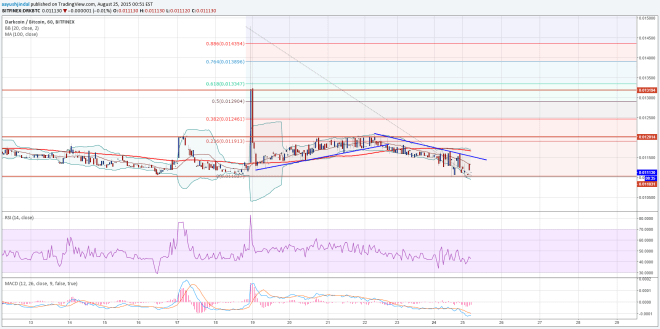

We need to see if sellers can manage to clear 0.0110BTC or not. A break below it may take the price towards 0.0104BTC. On the upside, an initial resistance is around a bearish trend line formed on the hourly chart, followed by the 100 SMA. The most important hurdle for buyers is still 0.0120BTC, and it is also coinciding with the 23.6% Fib retracement level of the last drop from 0.0147BTC to 0.0110BTC. For an upside move, the highlighted bearish trend line holds the key in the near term.
We also cannot discard the 100 SMA, as there were a lot of rejections noted around it and buyers struggled.
Intraday Support Level – 0.0110BTC
Intraday Resistance Level – 0.0115TC
The hourly RSI and MACD suggest buyers are struggling and sellers are in control.
Charts courtesy of Trading View