

Dash Price Key Highlights
- Dash price struggled to trade higher and continued to trade in a range with a major support at 0.0110BTC.
- There is a contracting triangle pattern formed on the hourly chart, which might act as a catalyst for the next move.
- One bearish sign is that the price is struggling to clear the 100 hourly simple moving average.
Dash price trading in a range, but looks poised for a short-term break as there is a triangle pattern forming on the hourly chart.
Break Ahead?
The Dash price continued to weaken and failed on many occasions to trade below 0.0110BTC. The most important bearish sign is that the price is below the 100 hourly simple moving average. As long as there is no break above the stated MA, the price might remain under pressure. Looking at the daily timeframe we can see that the price has been ranging for some time, and struggling to trade with one sentiment.
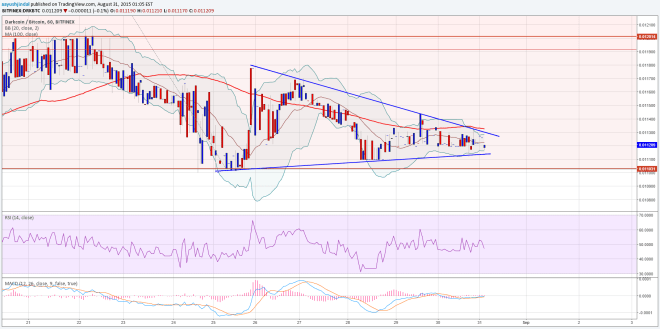

Now, there is a contracting triangle pattern formed on the hourly chart, which is on the verge of a break. It will be very interesting to see which way the price will head after the break. No doubt, there is a monster resistance around the triangle upper trend line as it is sitting around the 100 hourly SMA. A break above the highlighted resistance area might take the price towards the next barrier, which is around the 23.6% Fib retracement level of the last drop from 0.0147BTC to 0.0110BTC at 0.0120BTC. The stated level acted as a barrier many times, and could act as a pivot area moving ahead.
On the downside, the triangle support trend line is a support area in the near term.
Intraday Support Level – 0.0110BTC
Intraday Resistance Level – 0.0114TC
The hourly RSI is signaling more losses, which is a signal of caution moving ahead.
Charts courtesy of Trading View