Dash Price Key Highlights
- Dash price spiked higher sharply to register a new weekly high of 0.0147BTC where it found sellers.
- There was a flag pattern formed on the hourly chart, as highlighted yesterday which was breached to set the tone for an upside move.
- The price failed completely around 0.0147BTC, reversed more than 75% of gains.
Dash price climbed higher sharply Intraday, but failed to hold gains and traded back lower.
Failed attempt?
We highlighted in yesterday’s post that the Dash price could surge higher, as there was a flag pattern formed on the hourly chart. There was a break noted, and the price moved above the 100 hourly simple moving average. The price even settled above a few critical resistance areas, including 0.0120BTC and 0.0125BTC. The price traded as high as 0.0147BTC where sellers appeared to prevent any further gains. They not only succeeded in stalling the upside move, but also managed to push the price down to a great extent.
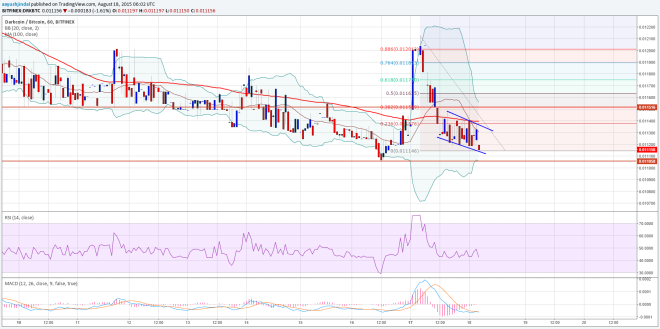

The downside move was swift, as more than 70% gains were trimmed by sellers. The price also closed back below the 100 hourly SMA to signal weakness in the near term. We can say it was a completely failed attempt to trade higher. Now, if the price moves higher again, then the 100 hourly SMA could act as a resistance along with the 23.6% Fib retracement level of the last drop from 0.0147BTC to 0.0111BTC.
On the downside, the recent low of 0.0111BTC holds the key for more losses in the near term. A break below it could take the price towards another important support area of 0.0110BTC.
Intraday Support Level – 0.0114BTC
Intraday Resistance Level – 0.0115TC
The hourly RSI and MACD also spiked sharply just like the price, but still pointing more gains moving ahead.
Charts courtesy of Trading View