

Dash Price : Key Highlights
- Dash price surged higher as forecasted in one of the previous week’s technical analyses.
- 0120BTC remains a major hurdle for buyers as it is a pivot zone.
Dash price moved higher and breached a few important resistances, which suggest that more upsides are possible.
Trend Line Break
We were anticipating a break higher this past week for the Dash price. There was a break towards the upside, as the price traded above a major bearish trend line on the hourly chart. The break was convincing, as the price settled above a major resistance level of 0.0116BTC. The mentioned level acted as a support and resistance on many occasions. So, the price settling above the same is a bullish sign, as the same level might now act as a support in the near term.
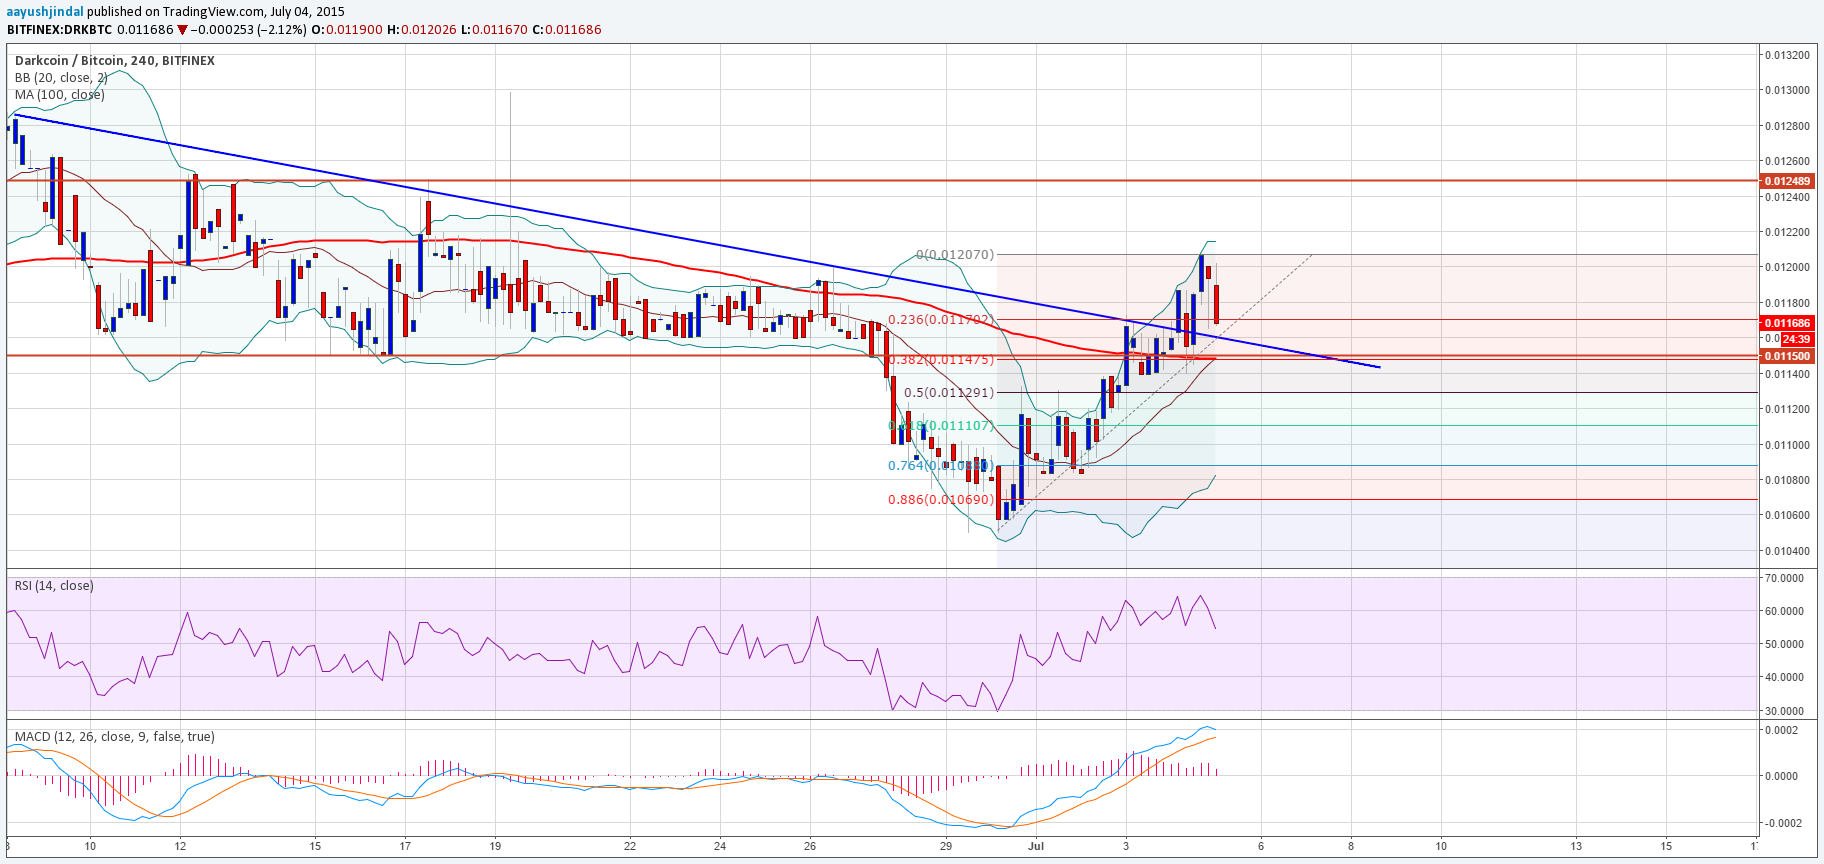
The price traded towards 0.0120BTC which is yet another swing area. There is a minor correction underway, which suggest that the price might move back to test the broken trend line. Moreover, the 100 hourly simple moving average is aligned with the 0.0116BTC support area. So, there is a critical support building on the downside where buyers might take a stand and prevent further losses if the price continues to move lower from here. Moreover, the Lower Bollinger Band is also sitting around the mentioned area, adding to the value of the support zone.
Intraday Support Level – 0.0116BTC
Intraday Resistance Level – 0.0121BTC
On the upside, a break and close above 0.0120BTC might take the price higher in the near future. However, there is a major barrier around 0.0125BTC, which is a previous swing high. So, there is a chance of sellers appearing around the mentioned area.
Overall, one might consider buying if the price dips a bit from the current levels.
Charts courtesy of Trading View