
Key Highlights
- Dash price surged higher before closing the week to test the previous swing high of 0.0127BTC as forecasted in one of the recent analysis.
- Bullish trend line formed on the hourly chart holds the key for a downside reversal in the near term.
Dash price climbed higher, but it looks like there is a major hurdle at 0.0127BTC which might set the price for a move lower.
Double Top Pattern at 0.0127BTC
We were anticipating the Dash price to move higher this past week. There was an upside reaction, but it was not strong enough to clear the last swing high of 0.0127BTC. The price failed miserably around the mentioned level, and it looks like it is forming a double top pattern around the stated level. We need to see how the price trades during the upcoming week, and whether the highlighted pattern is valid or not.
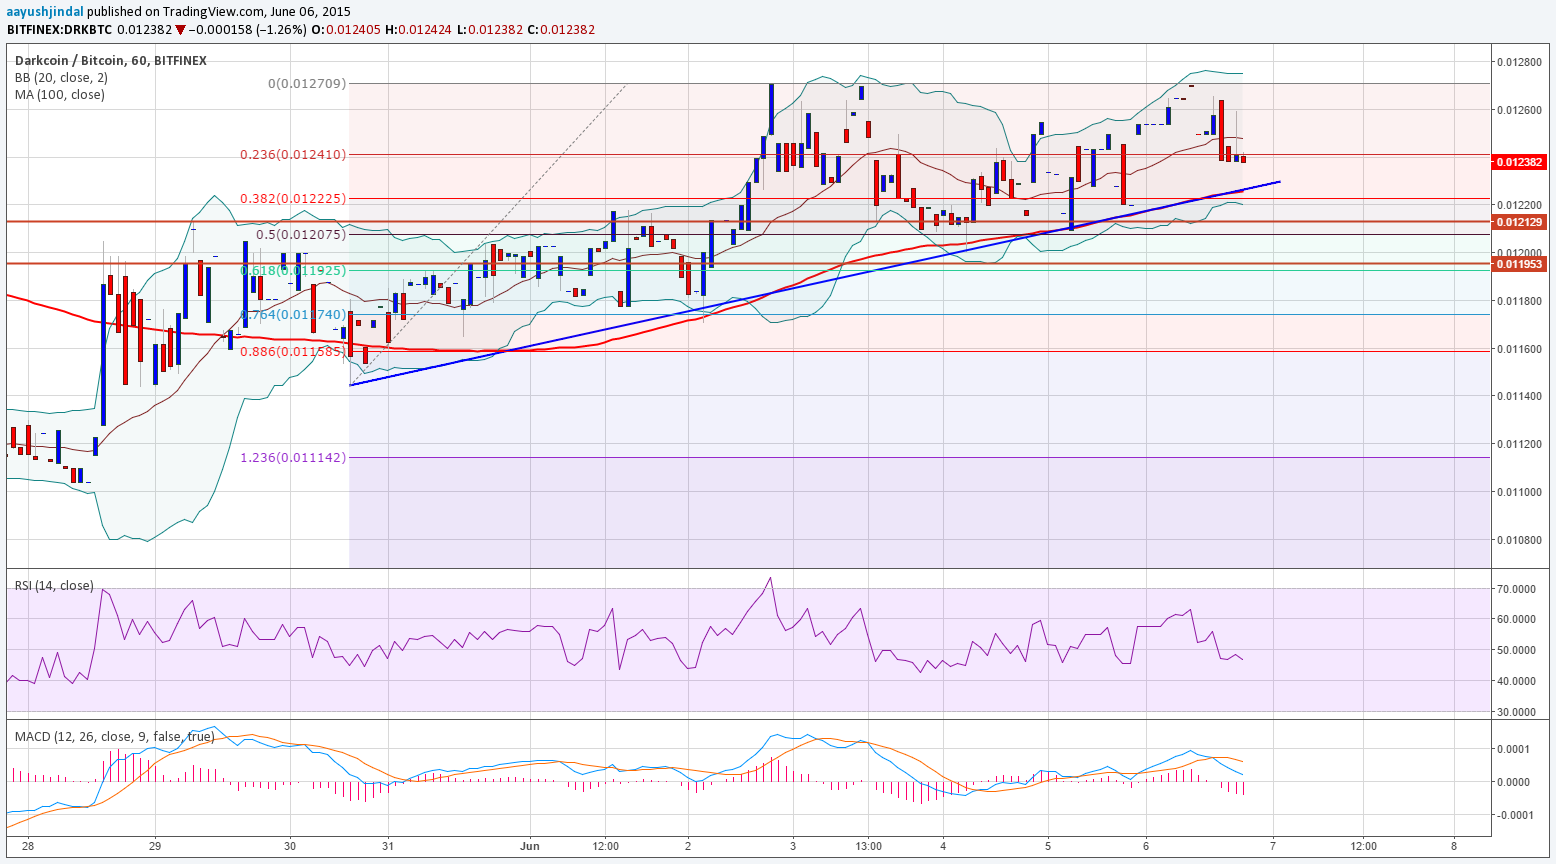
There is a bullish trend line formed on the hourly chart, which we also highlighted during this past week analysis. It is holding losses and acting as a catalyst for an upside move.
If the price has to move lower sellers must breach the bullish trend line. It won’t be easy for sellers to take the price lower in the near term, as the trend line is aligned perfectly with the 100 hourly simple moving average. Moreover, the 38.2% Fib retracement level of the last leg from 0.0115BTC to 0.0127BTC is also sitting around the 100 SMA, pointing that 0.0122BTC holds a lot of importance in the near term.
Intraday Support Level – 0.0122BTC
Intraday Resistance Level – 0.0127BTC
If the double top pattern is not valid, then the price might breach the last swing high at 0.0127BTC to open the doors for a move towards 0.0130BTC in the short term.
Charts courtesy of Trading View