

Dash Price Key Highlights
- Dash price continued to follow a downward sloping channel and looks set for more declines.
- Price is trading around the 100 hourly simple moving average, i.e. acting as a pivot area.
Dash sellers were seen in control and if they gain momentum, the price might break 0.0116BTC to trade lower.
Channel Break
We highlighted a critical descending channel on the hourly chart, which is acting as a catalyst for sellers and buyers. There were times when the price settled below the 100 MA and closed above it on a few occasions. There is a support area building around 0.0116BTC, which is around the Lower Bollinger Band and the previous swing area. Currently, the price is trading around the 100 MA, the channel resistance area and the 38.2% Fib retracement level of the last leg from the 0.0123BTC high to 0.0116BTC.
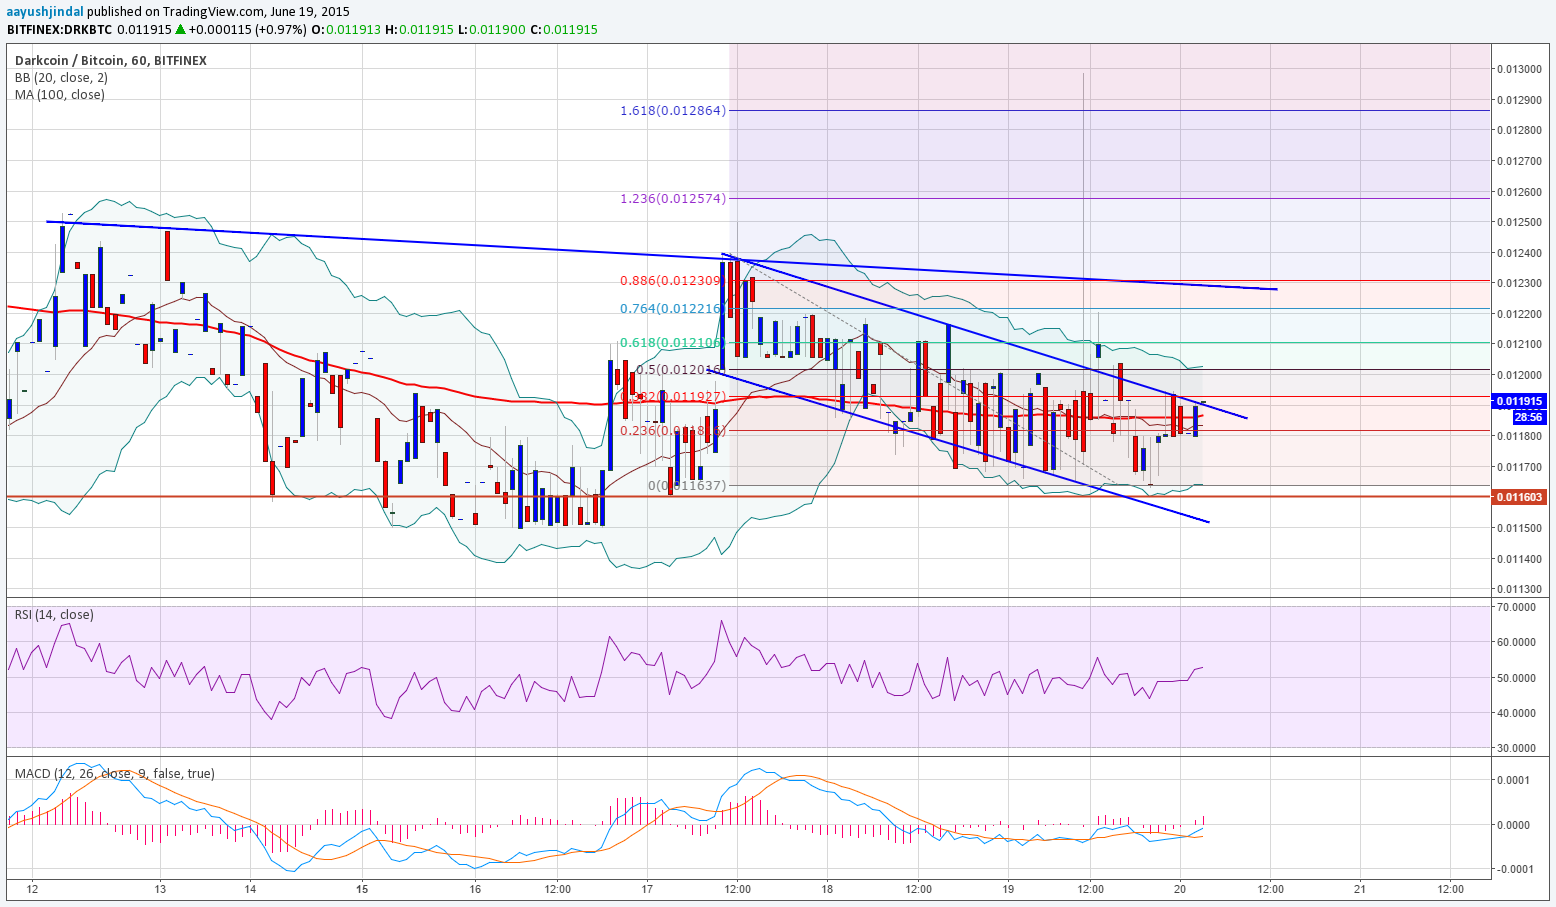
It has settled above the Middle Bollinger Band, but it needs a lot of things before the price can surge higher. The hourly RSI has moved above the 50 level, which is also a positive signs for buyers. If the Dash price moves above the channel resistance, then there might be a test of the 61.8% Fib level, followed by the bearish trend line. The MACD is heading towards the bullish zone, which may perhaps encourage buyers in the near term.
Intraday Support Level – 0.0116BTC
Intraday Resistance Level – 0.0121BTC
On the downside, there is a major support forming around 0.0116BTC, which is coinciding with the channel trend line. A break below the same might take the price towards 0.0112BTC. Any further losses might be limited as sellers need a reason to take the price lower.
In short, traders need to wait for a break before there can be any major move in a particular direction.
Charts courtesy of Trading View