Dash Price Key Highlights
- Dash price continued to trade in a range as there was no break below 0.0110BTC.
- As highlighted this past week there is a bearish trend line formed on the hourly chart, which continued to act as a barrier.
- The price is struggling to settle above the 100 hourly simple moving average, which is a negative call for buyers.
Dash price found support around 0.0110BTC one more time, which caused an upside reaction this past week.
Trend Line Break
The Dash price struggled to clear the range formed, and traded between 0.0110BTC and 0.0120BTC. There was a lot of bearish pressure on the price this past week, which pushed the price towards 0.0110BTC but buyers managed to protect a break. There is a bearish trend line formed on the hourly chart, which is continued to stall gains every time the price attempted to trade higher. The most important point is the fact that the price is also below the 100 hourly simple moving average, which is worrying sign for buyers. So, it might be a tough task for them to take the price higher and clear the highlighted trend line and resistance area.
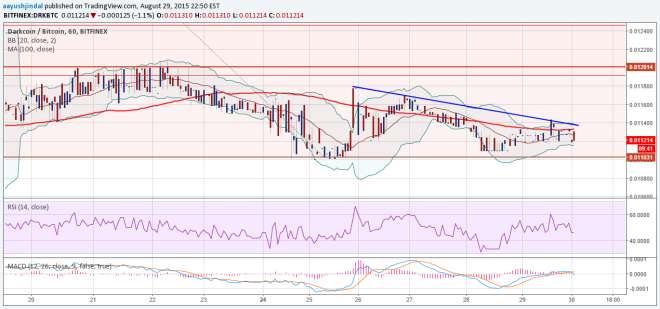

We must not forget the importance of 0.0120BTC, as it is a major pivot area where buyers struggled many times. The mentioned level is aligned with the 23.6% Fib retracement level of the last drop from 0.0147BTC to 0.0110BTC. Furthermore, it also represents a crucial pivot area for both buyers and sellers and there were a couple of failures noted around the stated resistance area.
On the downside, the last swing low of 0.0110BTC holds the key as a break below could ignite more losses.
Intraday Support Level – 0.0110BTC
Intraday Resistance Level – 0.0114TC
The hourly RSI and MACD are showing no sign of a bullish wave moving ahead.
Charts courtesy of Trading View