

Key Highlights
- Dash this past week settled above an important resistance area, but it looks like a false break.
- Buyers failed to gain momentum, as the price settled back below 0.0120BTC.
Dash buyers failed to take prices above 0.0125 twice, which means there are chances of it trading lower in the near term.
We highlighted an important resistance area this past week around 0.0125BTC, which acted as a barrier for buyers on more than two occasions. There is also a bearish trend line formed on the hourly chart of Dash, which added to the value of the highlighted resistance. The price once settled above the 100 hourly simple moving average, but later after failing at 0.0125BTC, it moved back below the 100 SMA. As stated time and again in the daily analysis there is a major support band formed around 0.0119-0.0120BTC, which is likely to act as a pivot area in the near term.
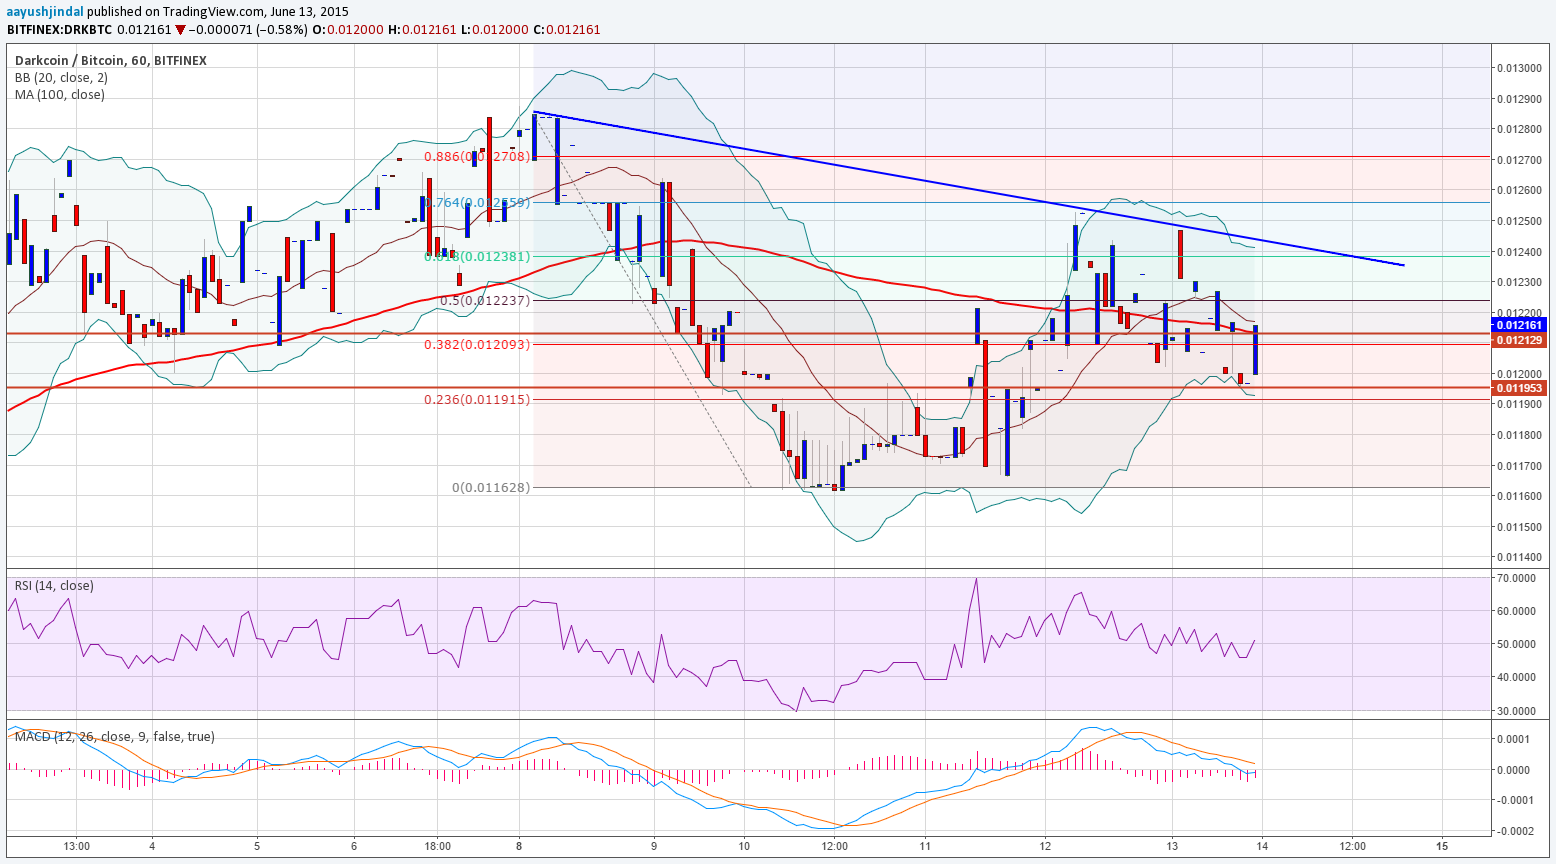
Moreover, the price failed just around the 61.8% Fib retracement level of the last drop from 0.0128BTC high to 0.0116BTC. There are more worrying signs for buyers to note, as the hourly RSI went below the 50 level and the MACD also tilted towards the bearish zone. There is a possibility that the price might move towards the highlighted trend line, which is coinciding with the Upper Bollinger Band. So, 0.0125BTC is a monster resistance area in the short term.
Intraday Support Level – 0.0114BTC
Intraday Resistance Level – 0.0120-2BTC
On the downside, once the price settled below 0.0119BTC, there might be a sharp move lower. In that situation, the price might head towards the last swing low of 0.0116BTC.
Overall, if the price moves higher from the current levels, then 0.0.125BTC might be seen as a selling zone for traders.
Charts courtesy of Trading View