
Dogecoin Price Key Highlights
- Dogecoin price moved lower and broken an important support area around 42.0 Satoshis.
- A bullish trend line and support area was breached to open the doors for more losses.
- 0 Satoshis might now act as a resistance, as the 100 hourly simple moving average is also positioned around the stated level.
Dogecoin price is under the bearish pressure as sellers managed to take the price below a critical support area.
Importance of 100 MA
As highlighted in the weekly analysis there were some signs of relief for the Dogecoin price, but that did not last forever. There was an important support area near the 40.0-42.0 Satoshis area that acted as a hurdle for sellers for some time. The price moved lower and broke the highlighted support area. Moreover, there was a bullish trend line formed on the hourly chart, which was also cleared by sellers to pave the way for more downsides in the near term. This was not all, as the price moved below the 100 hourly simple moving average.
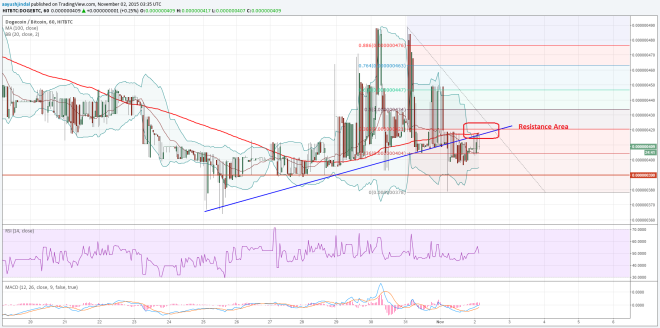

In short, we can say that the price is under the bearish pressure, as there are many negative signs on the hourly chart signaling more losses in the short term. If the price attempts to correct higher from the current levels, then it won’t be easy for buyers to take the price higher. The broken trend line and the 100 hourly MA might act as a resistance area and stall gains. Moreover, the 38.2% Fib retracement level of the last drop from the 49.0 Satoshis to 37.8 Satoshis could act as a resistance as well.
On the downside, the recent low of 37.8 Satoshis is a short-term support area.
Intraday Support Level – 37.8 Satoshis
Intraday Resistance Level – 42.0 Satoshis
The hourly RSI is just above the 50 level, which is for a change a positive sign for bulls.
Charts courtesy of Trading View