
Key Highlights
- Dogecoin price continued to trade in a range, and looks set for a near-term breakout.
- 66.0 Satoshis is turning out be a major support area for Dogecoin.
- A critical breakout pattern is formed on the hourly chart, which might ignite swing moves in the short term.
Dogecoin price settled below an important support of 70 Satoshis, signaling that buyers failed to capitalize and might struggle moving ahead.
Triangle Breakout Pattern
There was a consolidation phase noted for the Dogecoin price within a contracting range, which resulted in a breakout pattern formation. There is a contraction triangle formed on the hourly chart of Dogecoin, which is on the verge of a break. There are a couple of bearish signs to note, which includes the most important one that the price is below the 100 hourly simple moving average. Moreover, the price also settled below a critical support area of 70 Satoshis, which might not act as a barrier for buyers in the short term. To add to the pressure, the triangle resistance trend line is also sitting around 70.0 Satoshis. In short, the triangle pattern looks like a bearish one and might ignite a decline moving ahead.
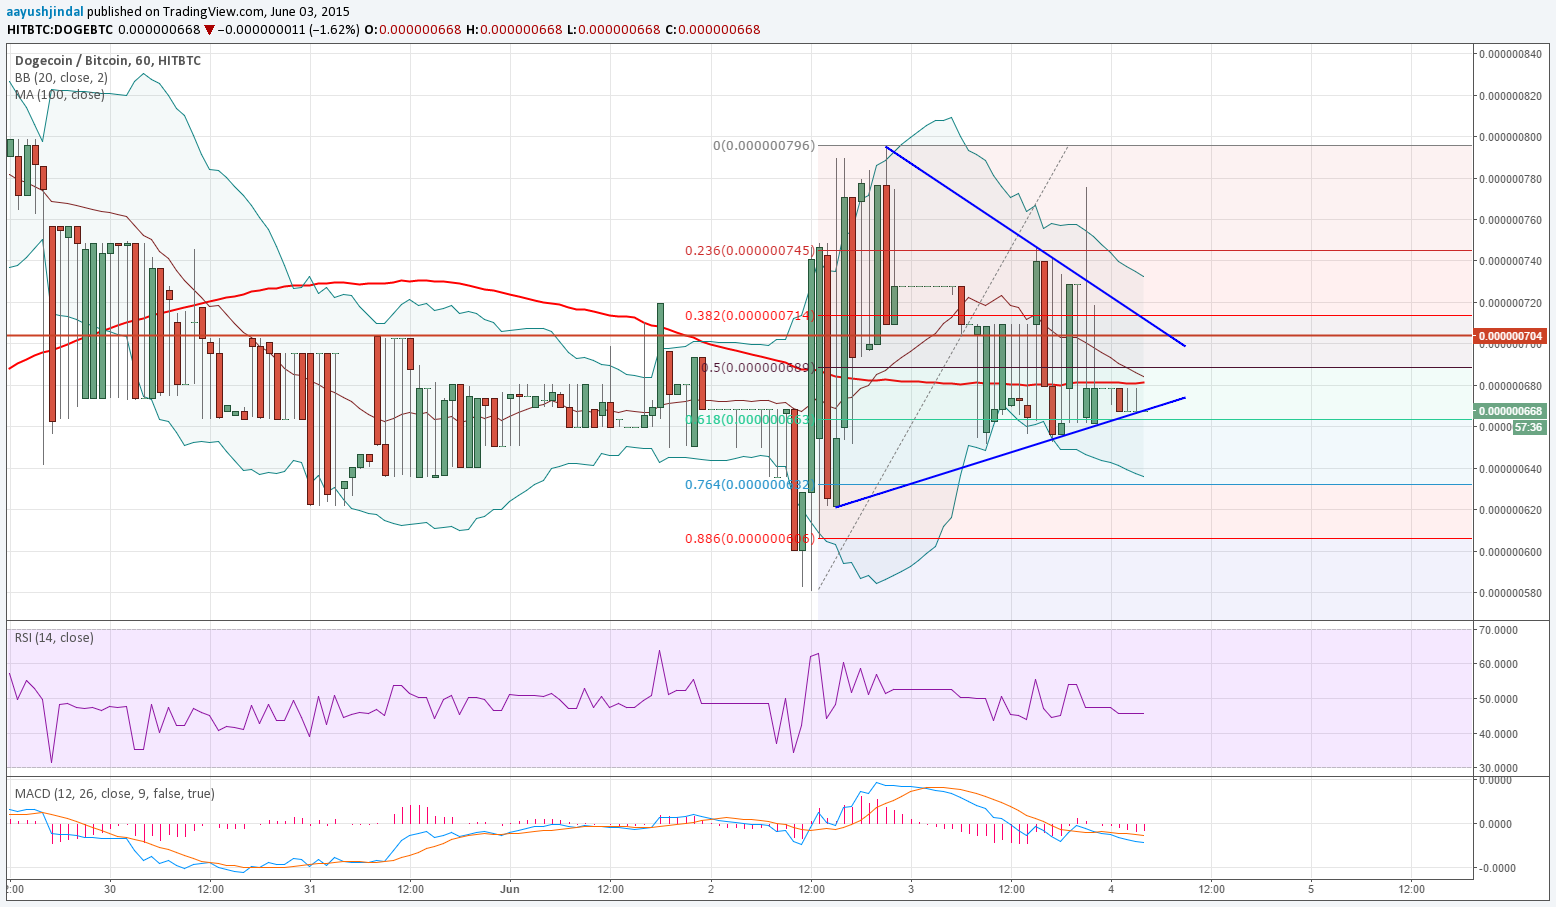
On the downside, the triangle support is aligned perfectly with the 61.8% Fib retracement level of the last leg from 58.0 to 79.6 Satoshis. A break below the stated support area might take the price towards the Lower Bollinger Band, which is at the 76.4% Fib level.
Any further declines may perhaps take prices lower for a test of the last low.
Intraday Support Level – 70.0 Satoshis
Intraday Resistance Level – 75.0 Satoshis
Let’s say the price breaks higher and settles above 70.0 Satoshis, then the Upper Bollinger Band could come into the action where sellers might appear to defend the upside.
Charts courtesy of Trading View