

Key Highlights
- Dogecoin price moved lower Intraday before finding support around the last swing low of 66.0 Satoshis.
- A bearish trend line formed on the hourly, which if breached might clear the way for more gains.
- On the downside, 65.0 Satoshis support area holds a lot of value in the near term.
Dogecoin price fell by more than 4% Intraday to trade near a bullish trend line as highlighted recently before a recovering from losses.
RSI Break and Divergence
As mentioned, there is a minor bearish trend line formed on the hourly chart of Dogecoin, which is currently staling the upside. The price is trading close to the highlighted trend line, as buyers are trying hard to break it to push the price higher. There is a very important bullish sign to note from the chart, as the hourly RSI is positioned for a divergence. There is a trend line on the RSI as well, which is broken signaling a divergence and a break. If the mentioned scenario is valid, then the price might break the bearish trend line to move higher.
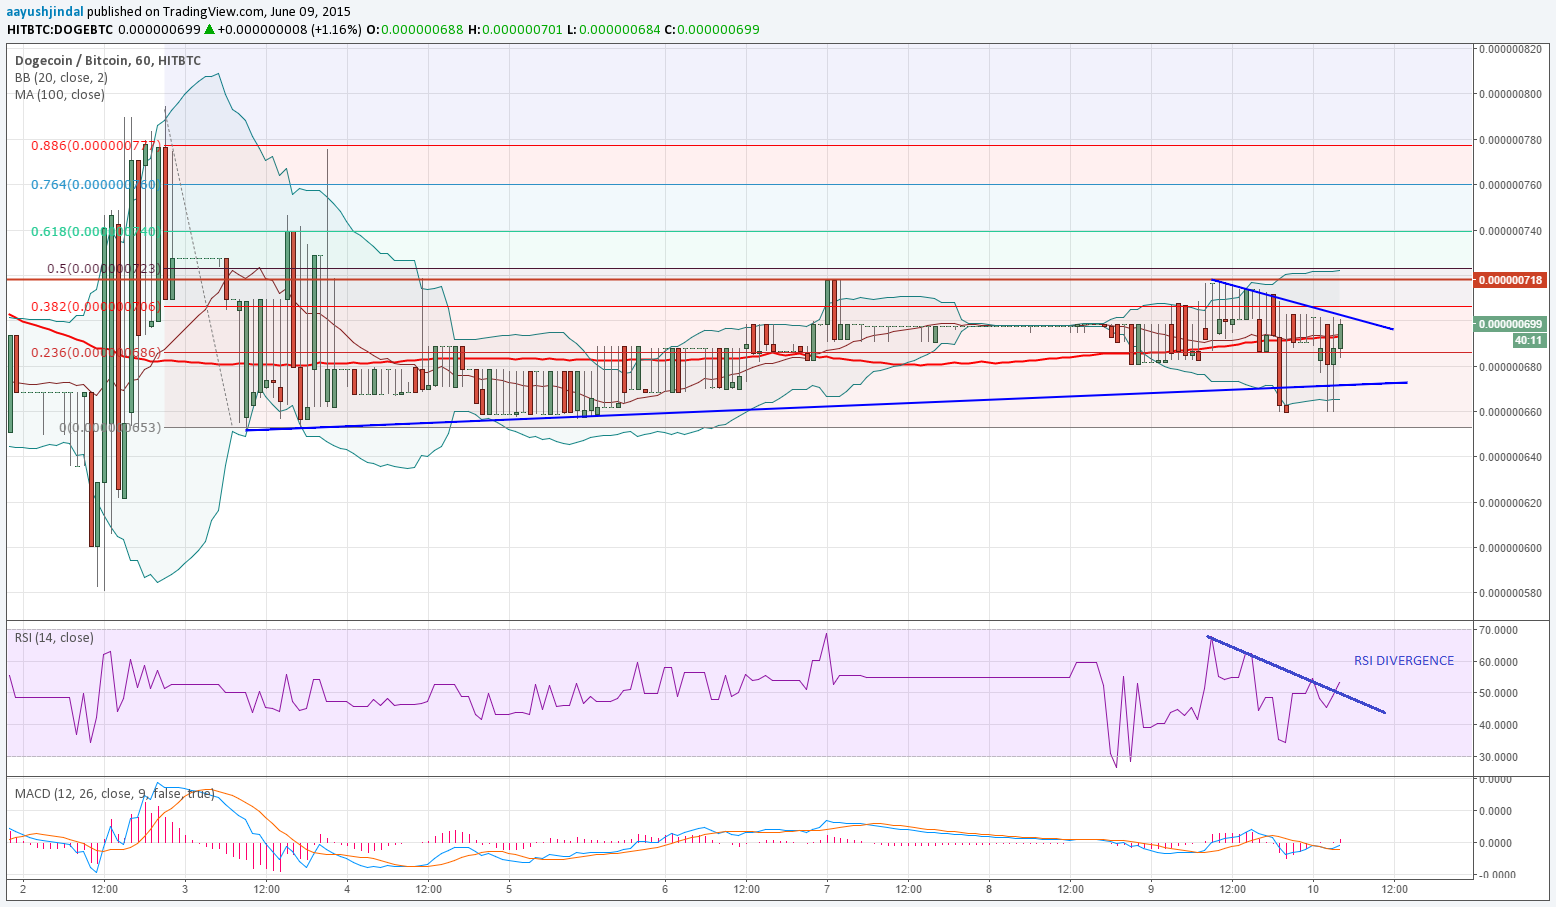
However, the most important hurdle for buyers above the trend line is around the 50% Fib retracement level of the last drop from 79.4 Satoshis to 65.3 Satoshis where they have struggled time and again. Currently, the price is flirting with the 100 hurly simple moving average.
On the downside, the bullish trend line, which we highlighted in this week’s post holds the key for more losses. A break and close below the same might call for a downside reversal moving ahead.
Intraday Support Level – 65.0 Satoshis
Intraday Resistance Level – 71.0 Satoshis
Overall, if the price manages to clear 71.0 Satoshis, then it might continue to move higher towards the next level of interest at 78.0 Satoshis.
Charts courtesy of Trading View