

Key Highlights
- It looks like there is no stopping the sellers, as the Dogecoin price continued to weaken Intraday.
- Yesterday’s highlighted sell idea played well, as the price declined below 35.0
- The hourly RSI is below the 50 level, signaling the fact that buyers are struggling to gain traction.
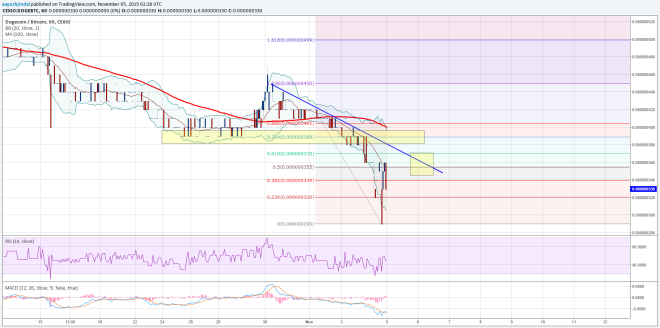
Dogecoin price broke yesterday’s low of 34.7 Satoshis to trade towards 30.0 Satohis which seems to be an important support area.
What we can expect next?
The Dogecoin price formed a new weekly low around 30.0 Satoshis, which represents a major support area and might ignite a corrective rally. However, there are still many resistances on the upside for buyers and it won’t be an easy task for them to clear them. There is a bearish trend line and 100 simple moving average (MA) confluence area formed on the hourly chart around 38.0-40.0 Satoshis. The stated resistance area holds the key moving ahead, and as long as the price is below it, sellers may remain in control.
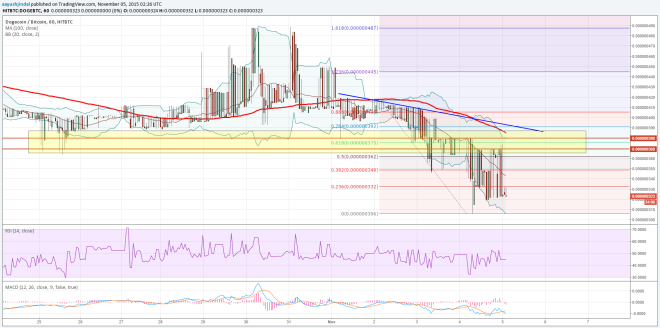

An initial resistance on the upside is around the 38.2% Fib retracement level of the last leg from the 41.8 Satoshis (high) to 30.6 Satoshis (low). A break above the same might open the doors for a move towards the 50% Fib level (41.8 Satoshis high to 30.6 Satoshis low) that is sitting near the highlighted confluence resistance area.
Looking at the indicators:
MA – 100 MA is positioned above the price and bending lower, which suggests that the buyers may find it tough to take the price higher.
MACD – There is a chance in the slope noted towards bullish, but there is no sign of relief as momentum is simply not there.
On the downside, we need to keep an eye on 30.0 Satoshis, as a break below it would be critical.
Intraday Support Level – 34.7 Satoshis
Intraday Resistance Level – 40.0 Satoshis
Overall, there looks like a chance of the price correcting higher towards 40.0 Satoshis.
Charts from HITBTC and CEXIO; hosted by Trading View