
Key Highlights
- Dogecoin price continued to struggle to break higher, but it looks like it might surge moving ahead.
- There is a bullish flag formed on the hourly chart, which if valid might push prices higher in the near term.
- The price is struggling to settle above 76.0 Satoshis, which is a warning sign on the other hand.
Dogecoin price traded higher recently, but there was a failure noted around 76.0-78.0 Satoshis which pushed it back lower.
Bull Flag?
Dogecoin price after trading towards 65.0 Satoshis one more time traded back higher, but failed to settle above an important level of 76.0 Satoshis. The price is now moving lower, but it looks like forming a bullish flag pattern on the hourly chart. If the highlighted pattern is true, then there are chances of the price trading higher in the near term. There are a couple of encouraging signs which add value to the current bullish view. First, the hourly RSI is above the 50 level. Second, the MACD is in the bullish slope with no signs of divergence as of writing. Last, the price looks good, suggesting more gains.
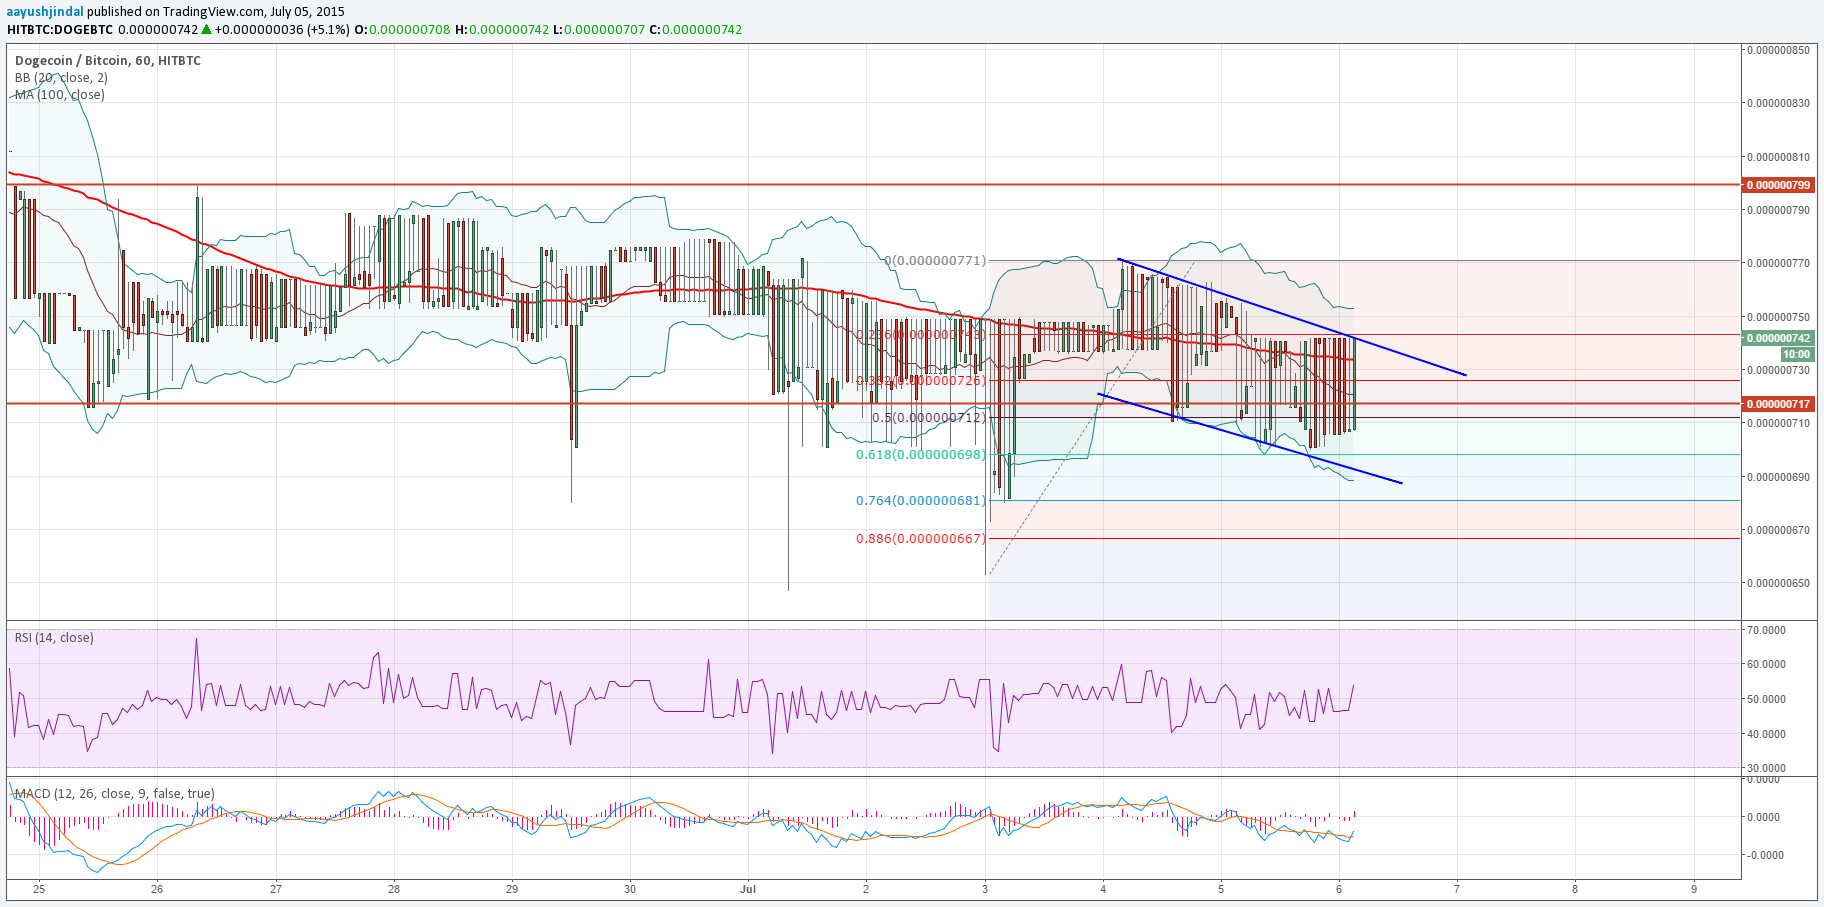
However, the price needs to convincingly settle above the 100 hourly simple moving average, and 76.0 Satoshis. If buyers succeed in doing so, then there are possibilities of the price breaking 80.0 Satoshis and moving higher. The mentioned level holds a lot of importance, and if there is a break above it more gains are likely.
On the downside, 70.0 Satoshis is a key area, followed by the flag support trend line. Any more losses might push prices towards 64.7 Satoshis.
Intraday Support Level – 70.0 Satoshis
Intraday Resistance Level – 76.0 Satoshis
In short we might consider buying if the price settles above the flag resistance and 80.0 Satoshis.
Charts courtesy of Trading View