
Key Highlights
- Finally, there was an upside move in Dogecoin, as prices breached 60.0 Satoshis.
- The biggest question is whether buyers can manage a daily close above 60.0 Satoshis or not.
Dogecoin buyers managed to take prices a few points higher above the all-important 60 Satoshis, and it looks like they might take it further above 61.0.
Can it break higher?
Dogecoin price moved above 60.0 Satoshis recently, but there was no follow through after the break. It traded as high as 60.8 before moving back lower. However, there are a few positive signs emerging on the hourly chart of Dogecoin, which suggests that the chance of price piercing 60-61.0 Satoshis has increased over time. Earlier, we thought that there might be a double top pattern forming around 60.0, as the price struggled on a number of occasions around the mentioned level but there was no downside reaction.
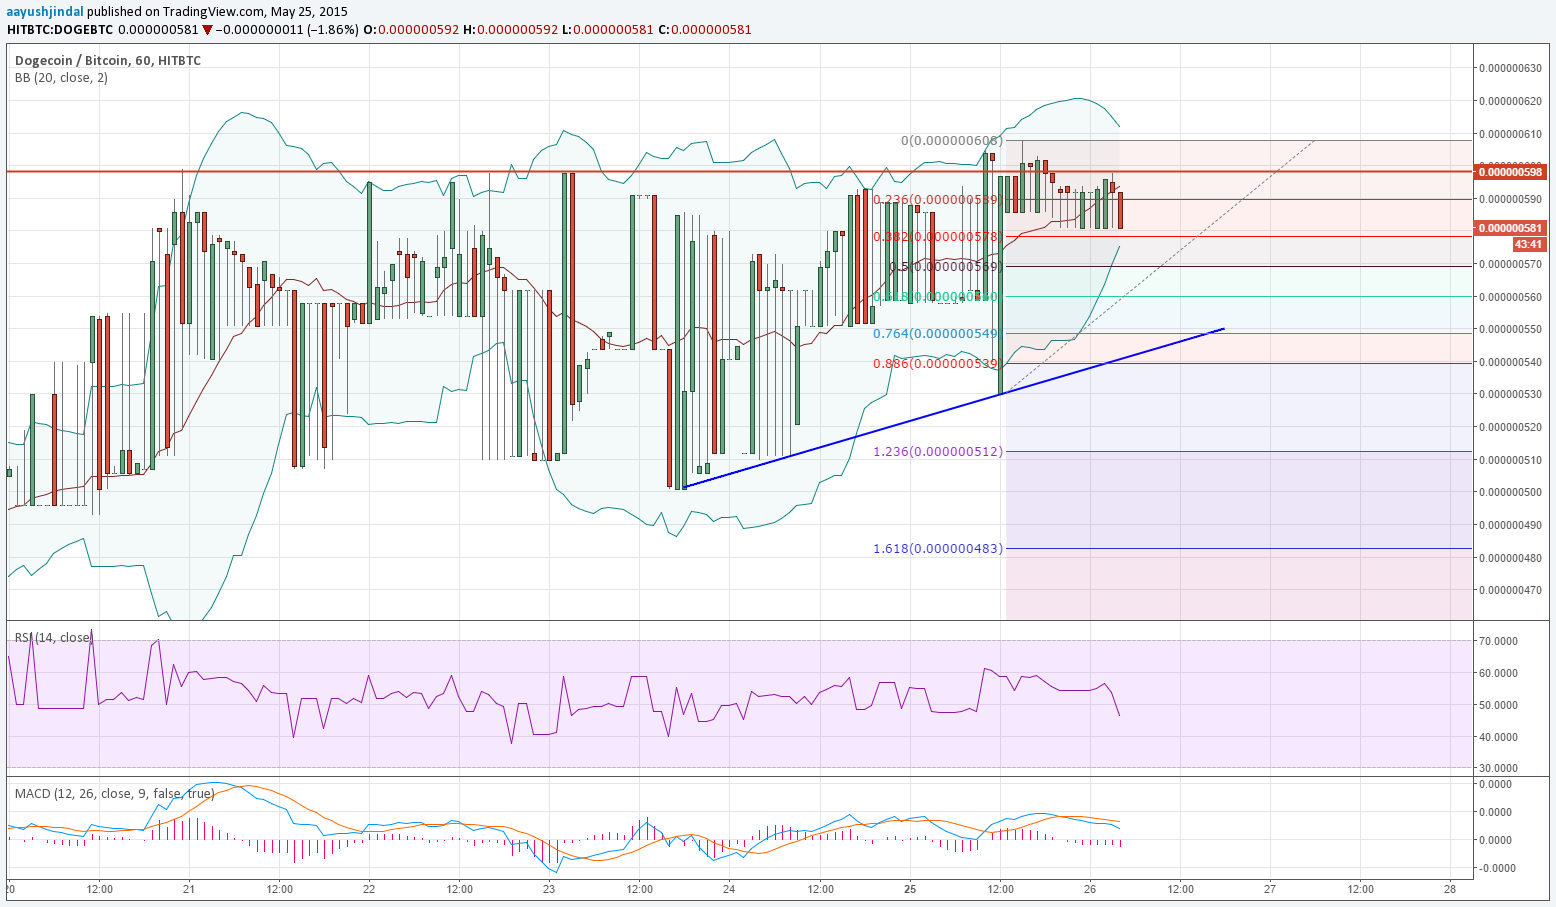
Sellers failed many times to take advantage and as a result, the risk of prices moving higher escalated. There is a bullish trend line formed on the hourly chart, which might provide support to Dogecoin if it moves or corrects lower from the current levels.
An initial support can be seen around the Lower Bollinger Band, which is sitting around the 50% Fib retracement level of the last leg from 53.0 Satoshis to 60.8 Satoshis. There is a nice bullish formation taking place, which if shapes up nicely might push prices higher in the short term.
Intraday Support Level – 56.9 Satoshis
Intraday Resistance Level – 60.8 Satoshis
On the upside, we need a convincing break above 60-61.0, plus a follow through after that. If buyers succeed in gaining pace, then sellers might be outpaced moving ahead. The hourly RSI and MACD are shaping up nicely, and setting up for more gains.
Charts courtesy of Trading View